
Actionable Summary
In 2024, about 50% of the entire budget deficit went just to paying interest on our accumulated debt. If the US government were a company, its CFO would have been fired a long time ago. In this report we outline The Efficiency Formula, which reflects the forces that allow the private sector to balance profitability and growth and how the US government could take a similar approach.
For the last 23 years the US government has been breaking the golden rule of budgeting: make more money than you spend. In 2024, about 50% of the entire budget deficit went just to paying interest on our accumulated debt
Rather than address this issue, the federal government continues to vote to raise the debt ceiling. This ever-expanding deficit isn’t sustainable, but it also isn’t inevitable.
The most effective private sector businesses often have operations that boil down to a two-piece framework to drive efficiency: context and control. “Context” refers to understanding where your spend is going. “Control” means proactively and precisely managing where spend occurs.
For both governments and businesses, while growing revenue is important, eliminating inefficient spending can be just as, if not more, effective at improving the bottom line.
Categories of waste in government spending are what we call “drag baskets.” This includes $100 billion in Medicare and Medicaid fraud, $200 billion in SBA loan fraud, and $236 billion in “improper payments.” These three “drag baskets” alone accounted for at least $536 billion wasted. That’s 7.9% of the government’s entire budget down the drain.
Increased context and control could prevent fraudulent transactions, leverage context around individuals and businesses to flag suspicious activity, and put predetermined limits on certain types of spending.
Procurement is a key opportunity for the government to increase efficiency by establishing internal benchmarks on prices and centralizing buying decisions.
Imagine a world where the US government is both more efficient and more effective. When America is at its best, it can accomplish exceptional things.
The USA’s $36 Trillion Problem
If the US government were a company, its CFO would have been fired a long time ago.
Most organizations, from companies to local and state governments, have to abide by the golden rule of budgeting: make more money than you spend. Every state except Vermont has stipulations dictating how they have to have a balanced budget. But for the last 23 years, the US federal government has been violating that rule and has been operating at a deficit.
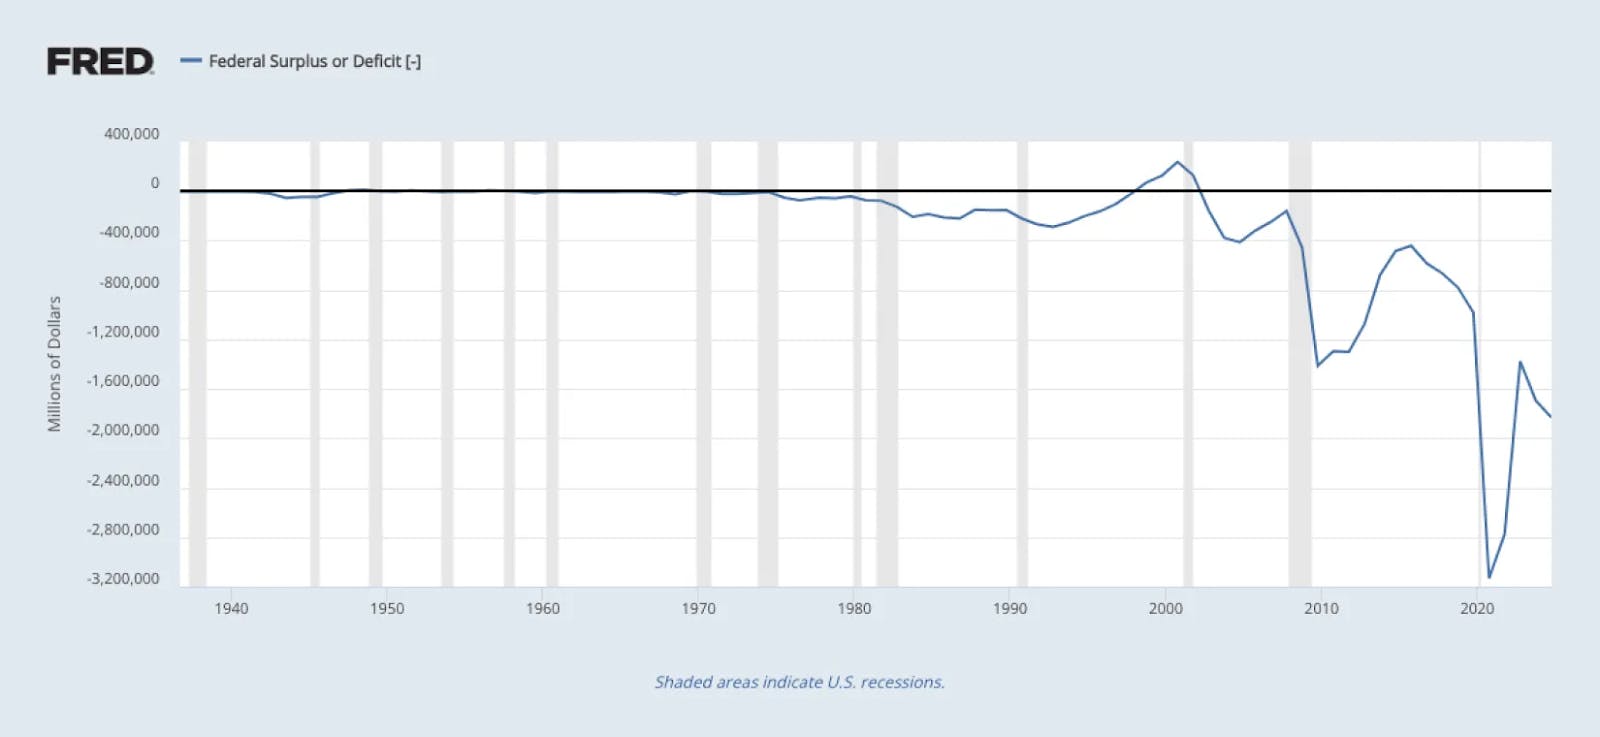
Source: US Office of Management and Budget
The result: the US owes a cumulative $36 trillion in debt as of December 2024, and that number continues to climb. In 2024, the US government generated $4.9 trillion in tax revenue compared to $6.8 trillion in spending, yielding a $1.8 trillion deficit. Our net interest payment alone for 2024 was $882 billion, edging out Medicare, Medicaid, and defense spending and becoming the second-largest single source of government spending behind social security. In other words, approximately 50% of last year’s budget deficit went toward paying interest on our accumulated debt.
Rather than address this issue, the federal government continues to vote to raise the debt ceiling, kicking the can further down the road. This ever-expanding deficit isn’t sustainable, but it also isn’t inevitable. As recently as 23 years ago, the US ran a budget surplus, and there’s no reason we couldn’t do so again.
In this deep dive, we outline The Efficiency Formula, developed by Ramp* and Contrary Research. This formula reflects the forces that have allowed the private sector to balance profitability and growth and how the US government could take a similar approach. Regardless of how critical it is, efficiency doesn’t just happen. It also doesn’t necessarily require a slashing of budgets. More often than not, focusing on two factors – context and control – can create a substantial impact and, ultimately, make an organization move faster.
The End of ‘Growth at all Costs’: A Tech Industry Case Study
2020-2021: Hypergrowth Drives Valuations
Many of the fastest-growing public companies of the last 15 years have been shaped by philosophies like “move fast and break things” and “blitzscaling.” Public markets rewarded companies that chased growth over everything with heightened valuations. In 2020 and 2021, the relationship between growth and revenue multiples surged:
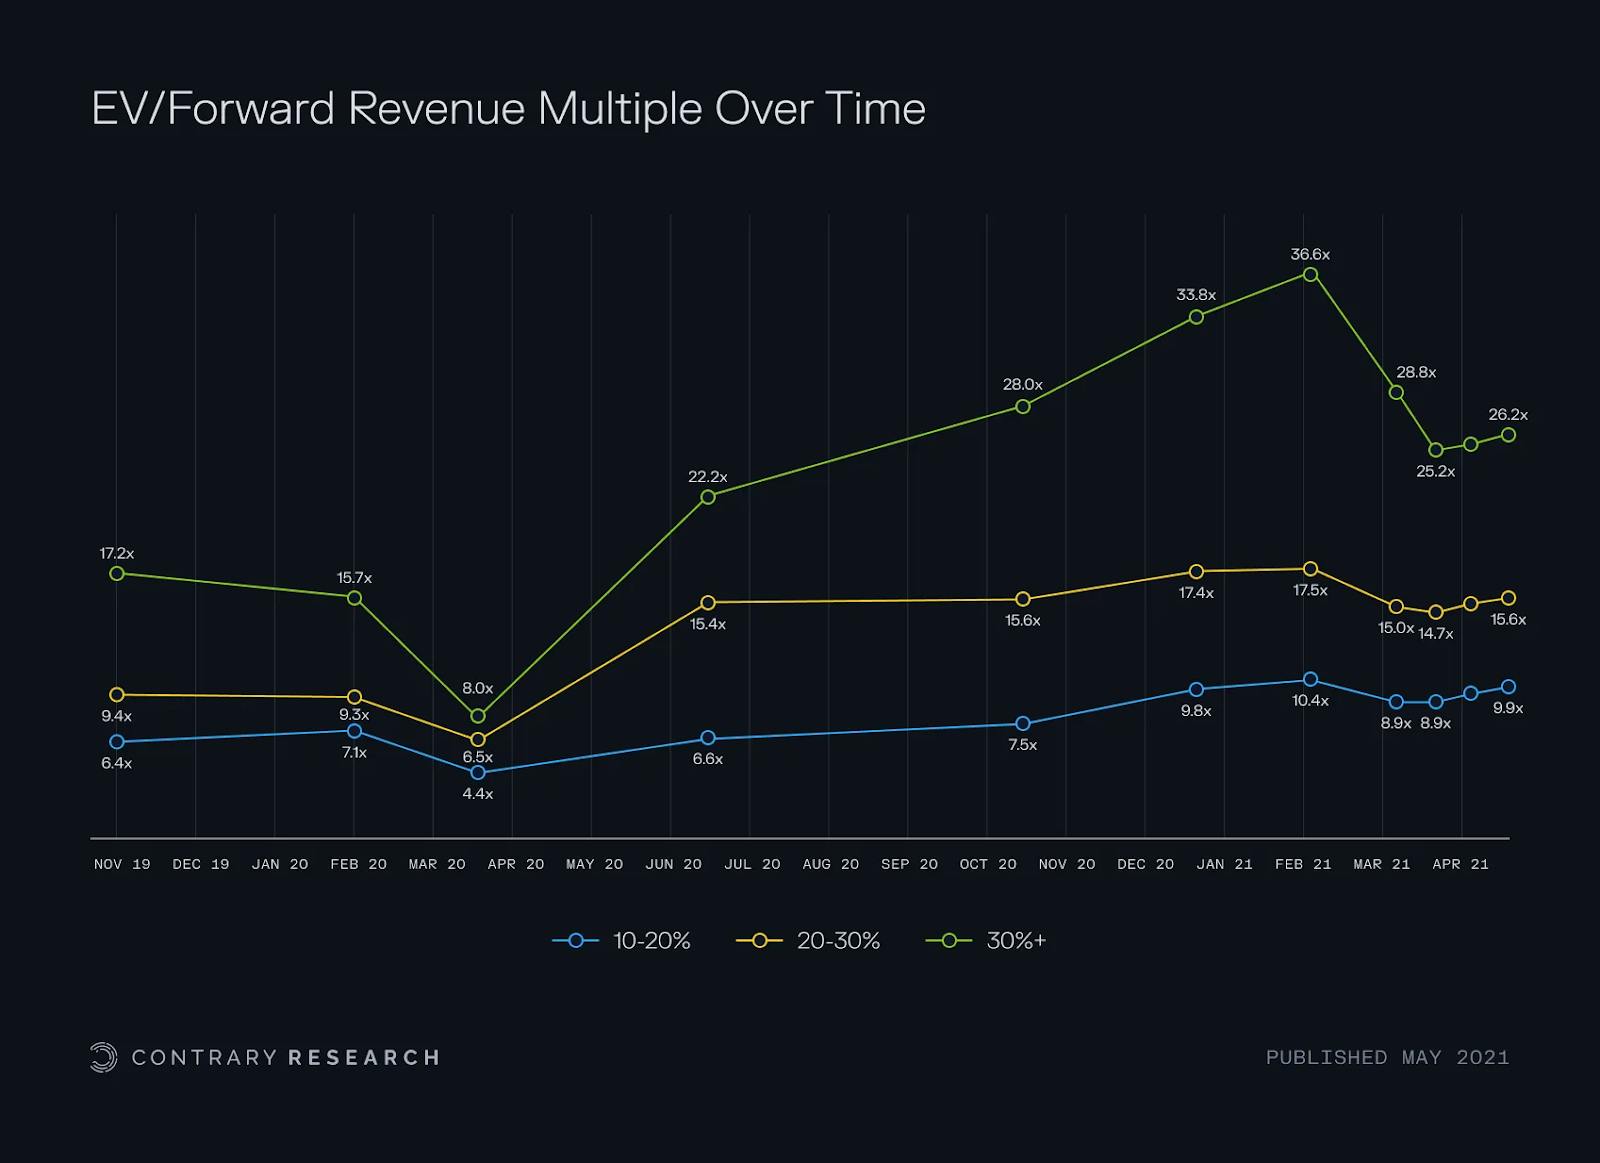
Source: Viola Group; Contrary Research
In November 2021, the fastest-growing publicly traded software companies saw median forward revenue multiples of more than 70x while the overall median multiple for SaaS companies was ~16x. Public markets were rewarding hypergrowth companies with premium valuations for each "unit of growth" compared to their slower-growth peers. Then, in 2022, the music stopped.
2022: Profits Take Back Their Power
2022 proved to be a warning shot for tech companies focused on growth over profit. The Federal Reserve raised rates seven times in 2022, and four times in 2023, sending the federal funds rate from near-zero to approximately 5.5% in a year and a half. Against this backdrop of volatile macroeconomic conditions, the Nasdaq-100 index fell by 33% in 2022.
For the first time in four years, profitability had a stronger correlation to positive stock returns than revenue growth for software companies.
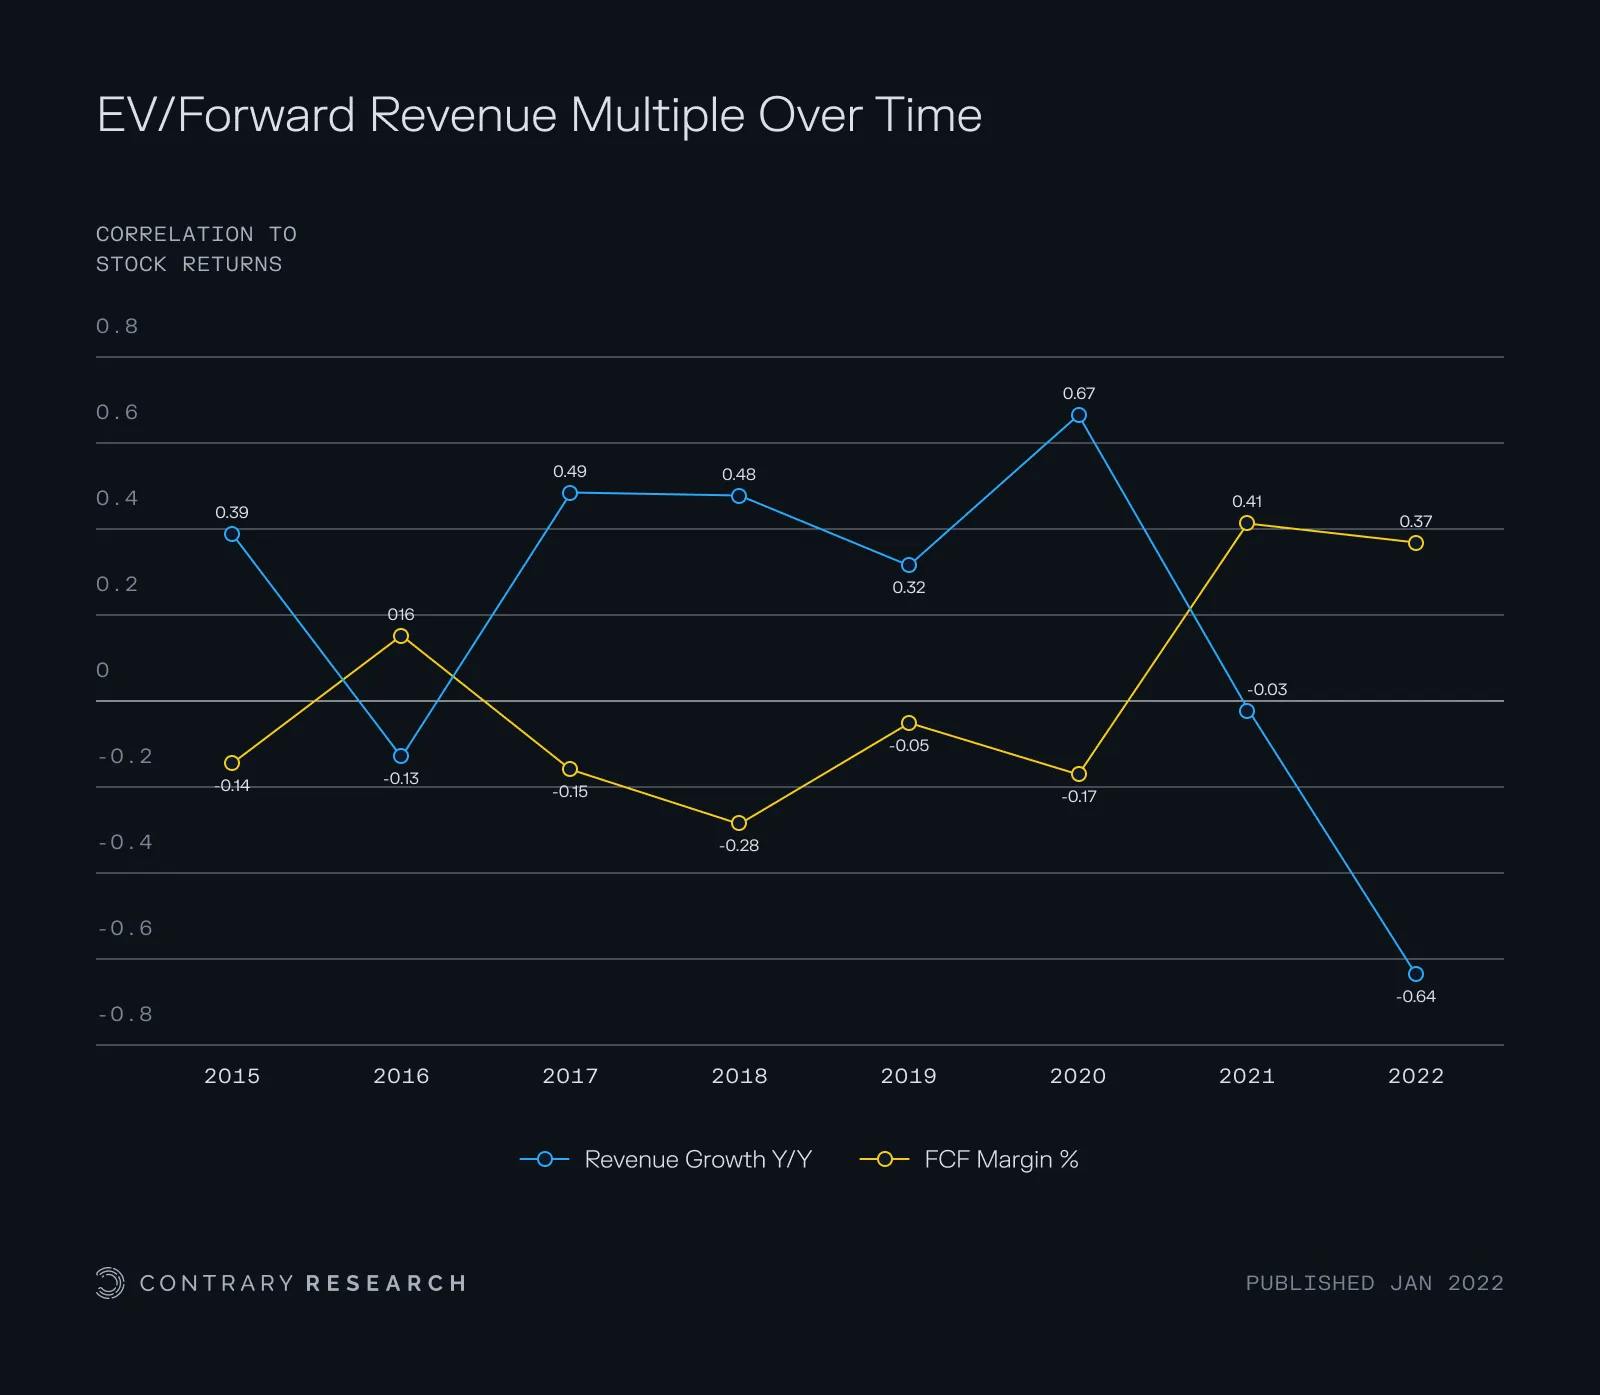
Source: Irving Investors; Contrary Research
These changing market conditions pushed tech companies to immediately change strategy, prioritizing profitability above growth. From June 2022 to June 2024, the average free cash flow margin across publicly traded technology companies improved from 3% to 16% while, in the same time period, the average revenue growth rate dropped from 38% to 18%.
In the private sector, market forces from competitors to activist shareholders can pressure companies to operate efficiently. But the US government operates without this pressure. While the government has a lot of competing priorities, efficiency is rarely one of them.
Spending is Cyclical – Just Not for the US Government
Businesses are cyclical, with revenue and earnings rising and falling with changing market conditions. However, US government spending has consistently increased regardless of market conditions:
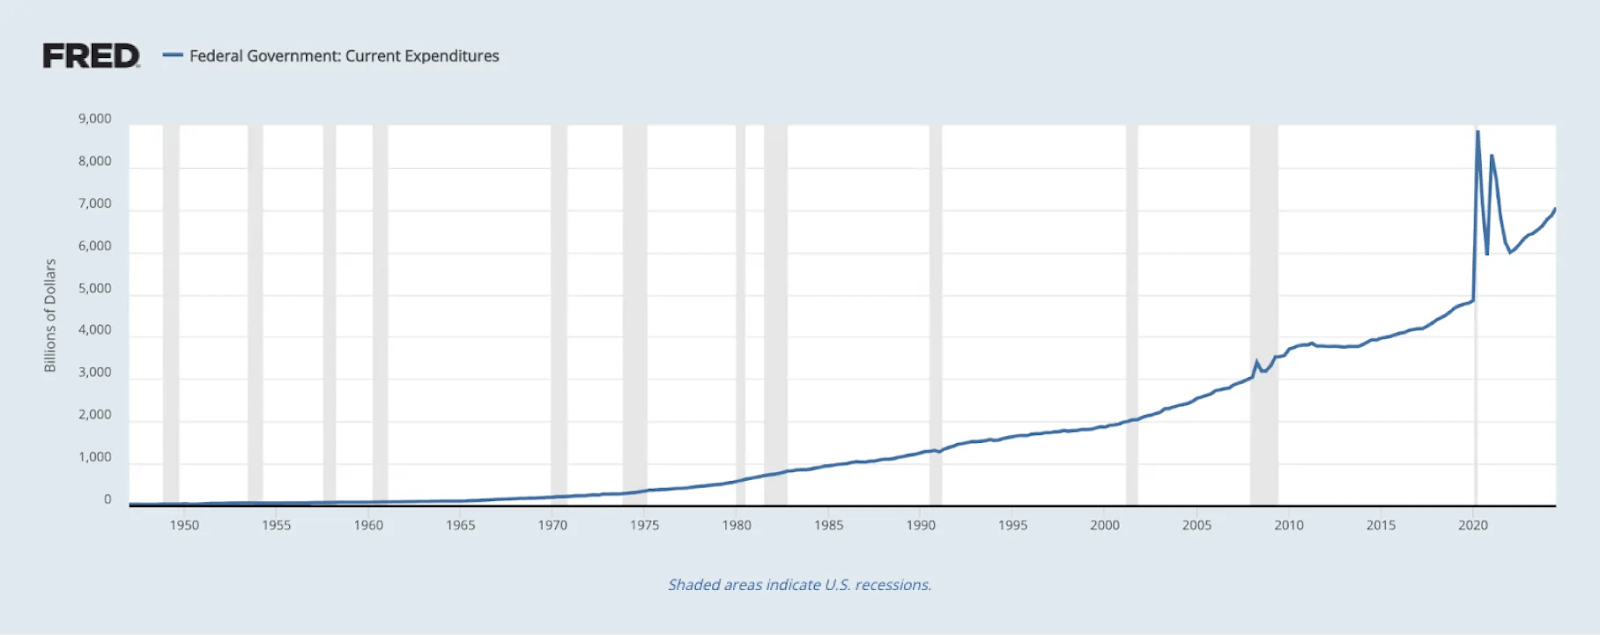
Source: US Bureau of Economic Analysis
Even after adjusting for inflation and headcount, government expenditure figures are still astronomical. In 2023 dollars, government spending per person in the US grew from $4.3K in 1965 to $19.6K in 2022, a 4.5x increase. From 1980 to 2019, inflation-adjusted federal spending grew by 2.3% annually, outpacing its 2.1% annual revenue growth. This trend accelerated in 2020 during COVID-19, when spending jumped 45% while revenue declined 2.6%.
Overall, the size of federal government spending in relation to GDP has grown by an order of magnitude over the past 100 years. In 1930, the percentage of spending to GDP was 3%; by 2023, it reached 22%.
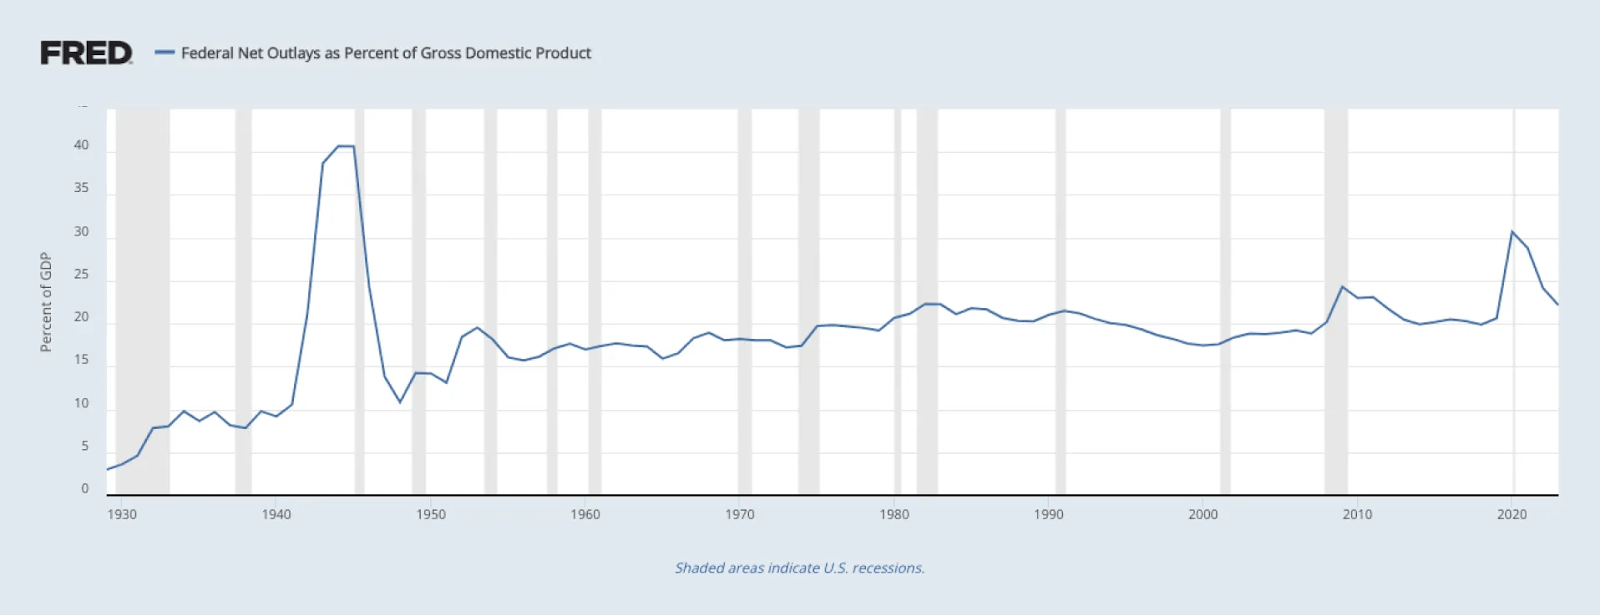
Source: OMB; St. Louis Fed
The government has made attempts to address government spending and budget deficits but has largely failed. One of the only attempts that has even had a passable impact was the creation of the Government Accountability Office (GAO). The GAO prepares 900 annual reports on government finances and investigations, but in 2010 couldn’t even render an opinion on the consolidated financial statements of the government because of “widespread material internal control weaknesses.”
Given our ever-expanding budget, one would hope that at least the outcomes of the US people would be continually improving, but that doesn’t seem to be the case. Outcomes have stagnated across a range of measures, including healthcare efficacy, education outcomes, and US military capabilities relative to expenditure.
Among wealthy nations, the US ranks last in healthcare access and outcomes, with life expectancy at 76.1 years versus the developed country average of 82.4.
In education, despite spending the second-most per student among 80 peer countries on education, US math scores hit an all-time low of 465 in 2023, below the international average of 480, with reading and science scores also declining.
The US military, which accounts for 37% of global defense spending, shows mixed results. During almost every war game the US loses against China. This is due to a combination of factors including overspending on ineffective, obsolete weapons systems and inability to make a proper accounting, with the Defense Department having failed seven audits in a row.
If a business had the same track record it wouldn't be allowed to operate. The average American business is being held to a higher standard than the US government.
A New Government Efficiency Playbook
Can the federal government take a page out of the private sector’s playbook to improve its efficiency? We think it can. The most effective private sector businesses often have operations that boil down to a two-piece framework that enables organizations to automate their path to efficiency: context and control. The more context and control an organization has, the more it can unlock its own performance velocity.
Context & Control Should Drive Government Spend Decisions
“Context” refers to understanding where your spend is going. It’s impossible to reduce spend that isn’t adequately tracked, and as we’ve seen time and time again, the US government’s spend tracking isn’t exactly getting the job done.
“Control” means proactively and precisely managing where spend occurs. One example is issuing specific vendors specific cards that are equipped with a strict budget for total spend, declining any overages. Policies can be enforced that ensure spending can only happen with a specific vendor or in a specific location or at a specific time. That’s control.
While the government is a much larger organization than any company, its efficiency issues stem from the same sources as smaller enterprises: lack of context and control regarding spend.
The Efficiency Formula
For organizations in the private sector who are used to moving and scaling quickly, taking action to improve context and control can feel like applying restrictions to limit one’s speed. In fact, the US government has deliberately created some of those limits by implementing unnecessary layers of bureaucracy to “approve” different processes. But every business that has improved its efficiency knows this is a misconception.
Think of any organization, whether a private business or government agency, as a vehicle driving down the highway. Holding other variables constant, one way to increase that vehicle’s velocity is by applying additional thrust, but another way is to reduce air resistance, or drag. The Efficiency Formula of increasing context and control focuses on the drag factor of the following equation:
Change in Velocity = c(Thrust-Drag)
While growing revenue (or increasing thrust) is important, eliminating inefficient spending (or reducing drag) can be just as, if not more, effective at improving the bottom line.
The average American business has a profit margin of 8.5%, meaning saving 1% on cost (drag) has the same impact on a company’s profitability as increasing revenue (thrust) by ~12%.
Assuming mass, or the size of an organization, remains constant, drag becomes a critical variable to how much that organization can accomplish.
Think of wasteful expenses as unnecessary drag holding an organization back. These wasteful expenses can be divided into specific categories of spend that we refer to as “drag baskets.” The less context and control you have over those drag baskets, the more they hinder an organization, and vice versa.
Given the trillion-dollar deficit figures, it might seem doubtful that targeted expense reductions could make a dent in our budget deficit. However, even a marginal reduction in spending would actually put us on track for a breakeven budget. In a November 2024 podcast with Bill Gurley, Altimeter’s Brad Gerstner pointed out that, assuming a conservative 3.5% annualized revenue growth rate by the US government, a 3% reduction in expenses each year would have the government back to a breakeven budget by 2029. For context, the government has grown its revenue by 4.5% annually since 2000.
Achieving a 3% reduction in expenses means cutting the lowest-hanging fruits of “drag baskets” on government efficiency. So, what do some of these drag baskets look like?
Inefficient Government Spending – The Main Culprits
Drag Basket 1: Medicare & Medicaid Fraud
As shown above, Medicare and Medicaid cost $874 billion and $618 billion respectively in 2024, making them the third and fourth largest government expenses. According to the National Health Care Anti-Fraud Association, these programs are losing more than $100 billion annually to fraud – and that’s likely a conservative estimate.
$100 billion in Medicare and Medicaid fraud represents 1.5% of total government expenditures. Solving that type of fraud alone would achieve half of the government's 3% expense reduction target.
So, how are these frauds propagated? It comes down to a lack of context around the flow of information and money.
Common schemes include criminals cycling prescription drugs through a closed loop: fraudsters recruit patients to get prescriptions, which pharmacies fill using Medicare funds. The fraudsters then clean and resell them to wholesalers, who sell them back to pharmacies for Medicare patients, and the cycle repeats. Basically, the same pills cycle through the system in a closed loop, with fraudsters extracting money from Medicare each time a prescription is filled while no one actually benefits.
Other schemes involve criminals setting up shell companies for medical equipment fraud and using stolen patient and doctor information to submit false Medicare claims.
In both cases, insufficient context around fund flows is to blame.
Drag Basket 2: SBA Loan Fraud
During the COVID-19 pandemic, the government disbursed approximately $1.2 trillion in COVID-19 Economic Injury Disaster Loans (EIDL) and Paycheck Protection Program (PPP) funds.
According to the Office of Inspector General (OIG), more than $200 billion – at least 17% of all COVID-related Small Business Association (SBA) loans – were fraudulent.
The OIG noted that “as pandemic assistance programs swelled to more than $1 trillion, the risk to the taxpayer increased because SBA’s internal control environment was calibrated to expedite loans and grants.” While OIG recommended stronger controls to the SBA, like validating per-employee loan amounts and business details, the SBA’s recommendations came too late. The combination of loose internal controls and minimal oversight created an environment ripe for fraud, costing taxpayers at least $200 billion.
Drag Basket 3: Improper Payments
According to the GAO, the federal government reported an estimated $236 billion in “improper payments” during fiscal year 2023, including overpayments, inaccurate recordkeeping, and fraud. 74% of these improper payments were overpayments, such as sending money to deceased individuals or people no longer eligible for government programs.
In what’s becoming a common theme for the examples of wasteful expenditures discussed in prior “drag baskets”, the GAO noted that federal agencies need to conduct better monitoring to minimize improper payments. In other words? Not enough context, and not enough control.
Applying The Efficiency Formula
These three “drag baskets” alone accounted for at least $536 billion wasted. That’s 7.9% of the government’s entire budget down the drain. Even cutting those figures in half would go a long way in helping the government reach a balanced budget. So what happens if you take a page out of the private market playbook and apply the Efficiency Formula to some of the waste in these drag baskets?
How To Increase Context
Managed Card Programs Highlight Wasteful Spending
When businesses focus on context and control, they bring significantly more of their spend into programs that make control possible. For example, users of a platform like Ramp can quickly move from zero to over 50% of spend in control programs. This shifts previously unmanaged money into tracked systems with budgets, context, and monitoring capabilities, including vendor restrictions and spending controls.
Similar control needs exist in Medicare and Medicaid, which represent nearly $1.5 trillion in hospital care, physician services, and prescription drugs. Many services are reimbursed through pharmacies, creating fraud opportunities.
Prescription drug costs illustrate the problem. While essential for two-thirds of Americans, prices have increased almost 40% in the last decade, partly due to pharmacy-drug company relationships that favor “branded drugs over less expensive generics.” Medicare and Medicaid lack transaction context, but card programs could enable alerts for branded vs. generic prescriptions and show which pharmacies are clearly favoring brands over generic options.
The same principles apply to fraud prevention. Better context around recipients could flag unusual patterns, like patients receiving excessive medications for their conditions or SBA loans spent inappropriately given a businesses’ profile.
These improvements don’t require us to cut back on Medicare, Medicaid, or SBA loans, which are critical programs that support millions of people in their health and livelihood. But additional context around where this spend is going ensures protections around both accidental and deliberate inefficiency. Reducing waste and fraud ensures there's funding for the people who truly need it.
How To Increase Control
Declined & Flagged Transactions Stop Wasteful Spending Before it Occurs
Beyond just providing more context, these organizations need to exercise control over spend before it happens, not just retroactively. That’s control. Any organization that tries to manage a budget will have wasted spend they would stop if they could. One example of the Efficiency Formula in practice is enabling spend to be automatically declined. As an example, in the last 12 months, Ramp has declined nearly 1.3 million transactions on behalf of customers representing $1.9 billion dollars of spend just based on budget overages alone.
Flagged or declined transactions can feel synonymous, but both are valuable. Declined transactions can be set up for any number of reasons to ensure inefficient spend doesn’t occur in the first place. Card limits, suspended or terminated cards, and missing policy items are some of the common drivers behind Ramp's millions of declined transactions.
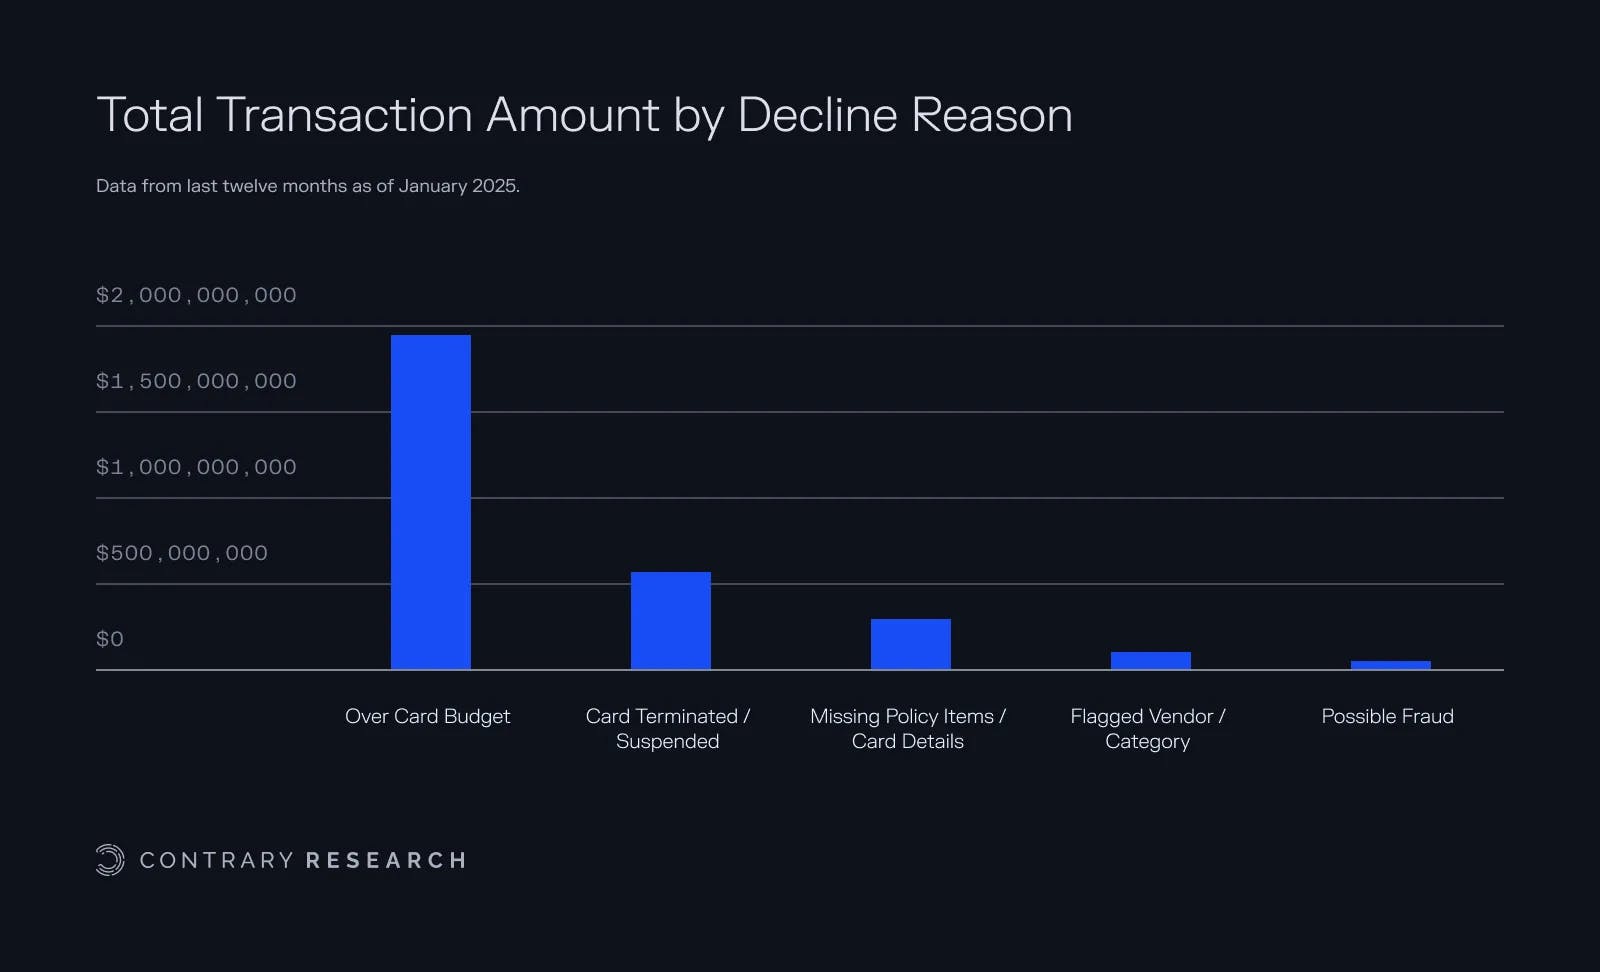
Source: Ramp
Flagged transactions, on the other hand, involve policies that aren’t necessarily indicative of spend to shut down. They’re more like an actionable list of questions. The alternative is often just hoping the existing systems work, or maybe eyeballing billions of dollars of transactions. Not exactly an efficient approach.
One of our drag baskets included an estimated $236 billion in “improper payments” including overpayments, inaccurate recordkeeping, and fraud. More than 74% of errors were overpayments such as “payments to deceased individuals or those no longer eligible for government programs.” While the Social Security Agency (SSA) tracks deaths and the IRS has eligibility data for programs like government healthcare and housing subsidies, this information isn't being utilized effectively. If an individual is flagged by the SSA as deceased, the IRS as above the income level for government programs, or a business is noted as shutdown, those should automatically create flagged or declined transactions for relevant payments.
Centralized Vendor Procurement Levels the Playing Field
The Efficiency Formula is built around making context and control simpler. Doing so after a transaction has taken place is just one piece of the puzzle. Another is reducing wasted spend before it happens. A unified procurement platform centralizes purchase decisions, giving both requestors and approvers full context before any spending occurs.
This unified approach offers key advantages in fighting the war on waste: (1) Approvals have as much context as possible, (2) Purchase prices are benchmarked against all the information available, and (3) Vendor awareness is universal rather than locked away in silos.
The US Government Needs More Context
Adding context is embedded in everything we’ve talked about so far, and is even more valuable when understood before spend approval. While reports like the annual Congressional Pig Book scrutinize inappropriate government spending, these retroactive reviews don’t prevent inefficient spend. Transparent approval processes ensure all context is available upfront, effectively exposing potential waste before spending occurs.
To Avoid Overspending, We Need to Benchmark Pricing
Benchmarking pricing is often impossible when every purchase happens in a vacuum. It's a common economic idea that when information is expensive or unavailable, price disparity for any purchase will be much more significant.
Look no further than Indian fish markets in the early 2000s to illustrate that point: a 2007 study of South Indian fisheries found that “the adoption of mobile phones by fishermen and wholesalers was associated with a dramatic reduction in price dispersion.” Turns out that as soon as each participant in a transaction has more context on the current price they are more likely to avoid overpaying.
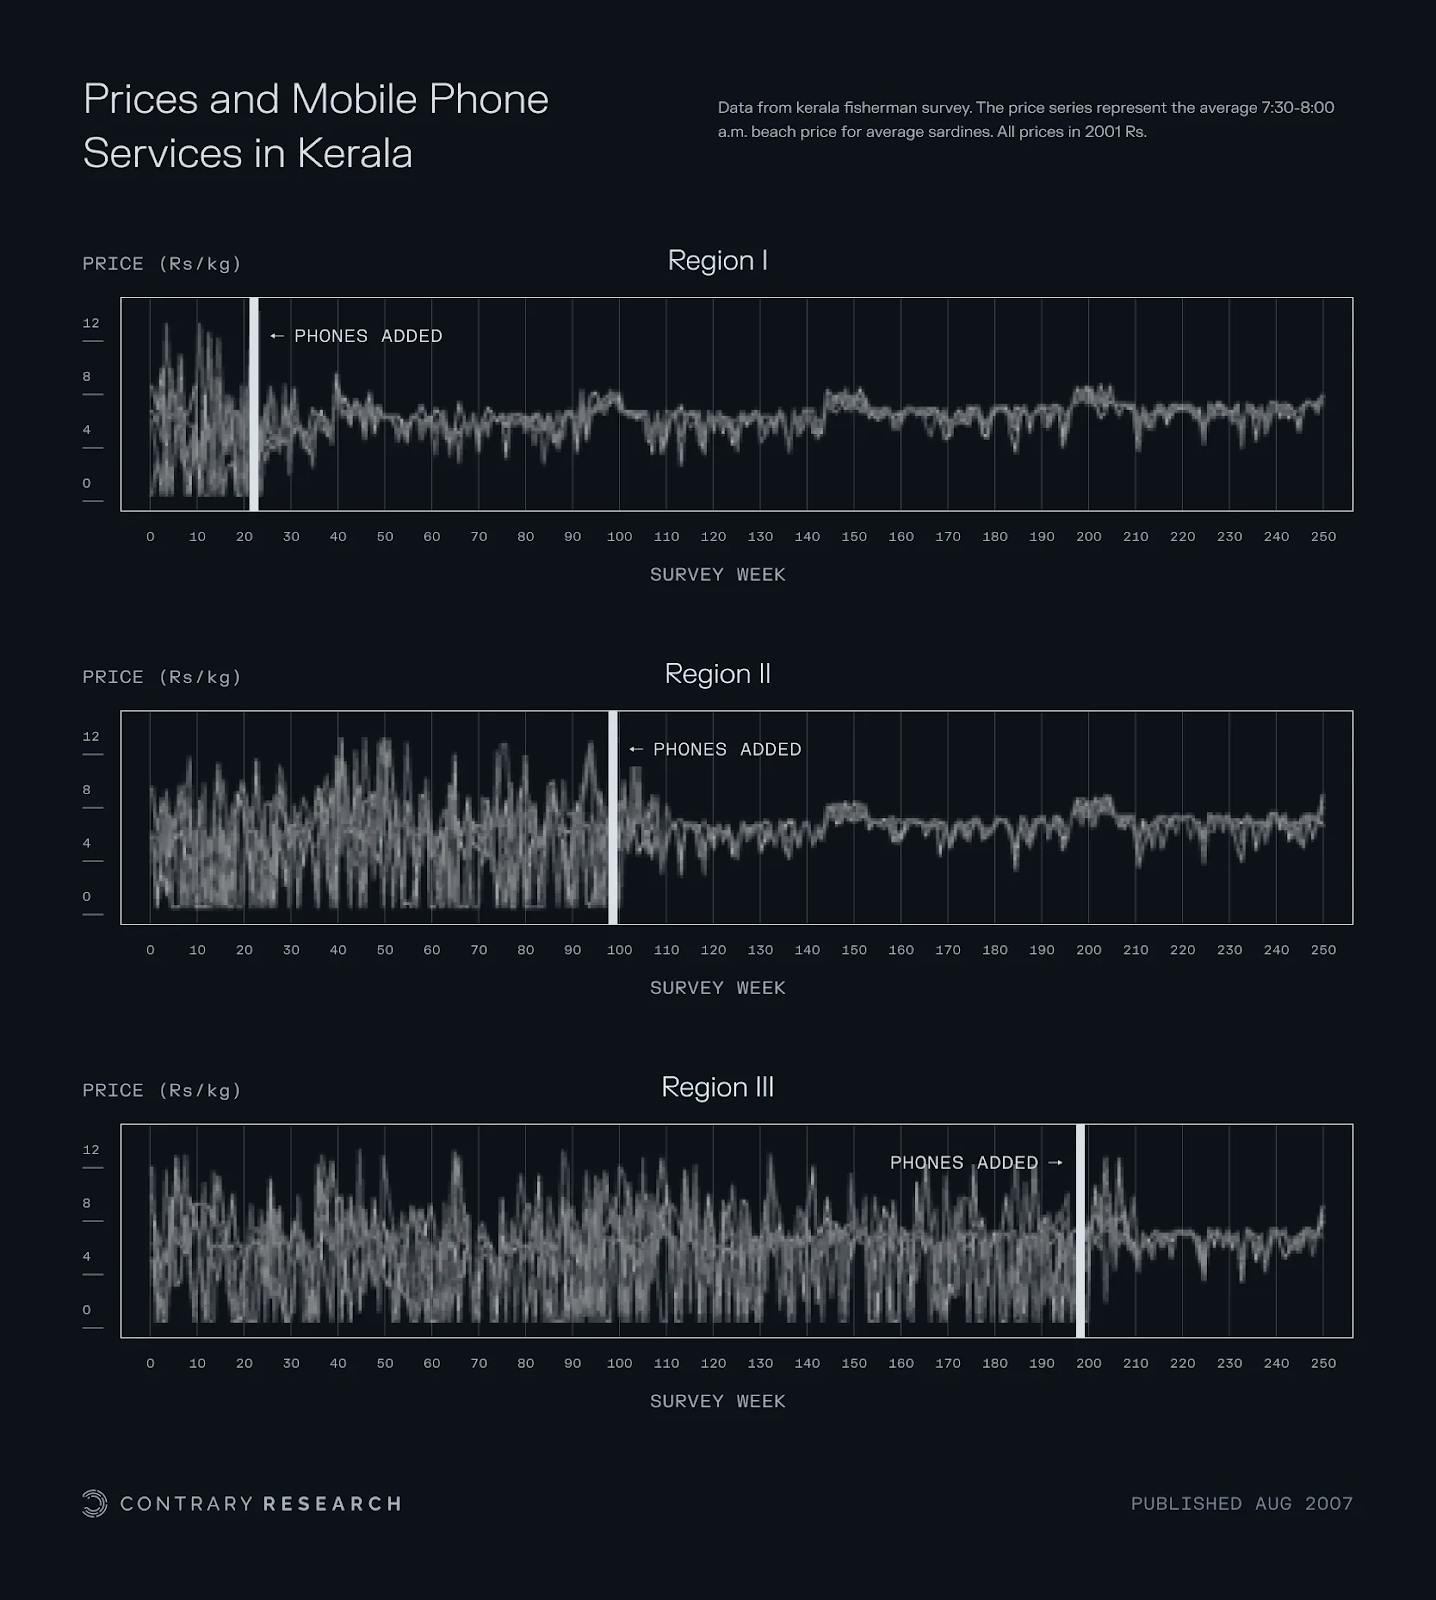
Source: Oxford; Contrary Research
The same is true of benchmarking purchases in procurement. The more context you have on pricing the less likely you are to overpay for any particular vendor, service, or product. For example, take the hypothetical exercise of purchasing a business intelligence (BI) dashboard. These are common platforms used across federal agencies.
When purchasing a BI solution, an agency may need anywhere from a couple to hundreds of user seats. The price per seat that an organization may pay has a similar variance to fish prices before the introduction of mobile phones. Imagine you’re making a buying decision about a BI solution and you have this data at your fingertips. Do you think you’d end up paying the high end of the pricing range? Probably not.
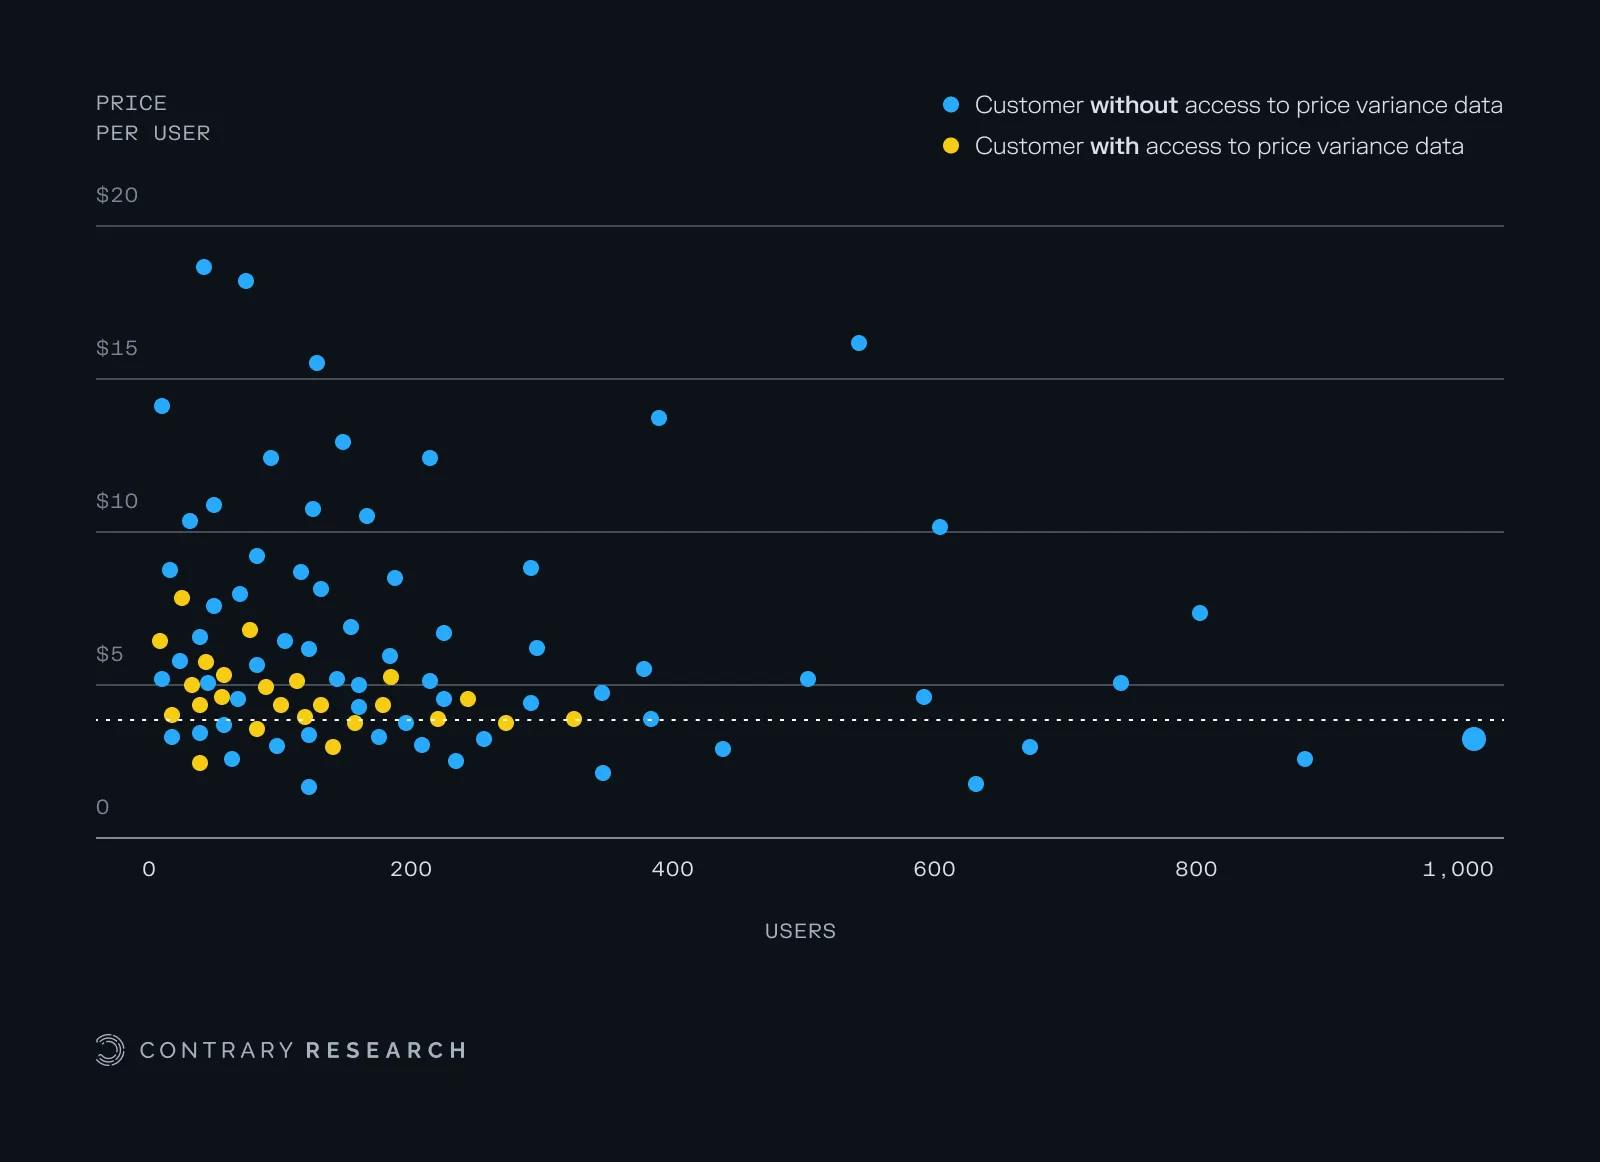
Source: Ramp; hypothetical price variance analysis on a BI solution
As valuable as benchmarking is, it’s only possible when procurement is centralized. Making sure all of your purchasing decisions are happening in one place ensures that you have all the context available. One of the biggest roadblocks to efficient government procurement is silos around context for particular vendors.
Government Agencies Work in Silos – and Overspend on Vendors as a Result
In 2023 the US government spent $759 billion on contractors, with 60% of that spend coming from the Department of Defense. The spend was spread across over 600K entities that fill government contracts. Some estimates indicate up to a quarter of that spend could be inefficient – from price gouging to improper reimbursements to geographic disparities due to special interests. It adds up pretty quickly.
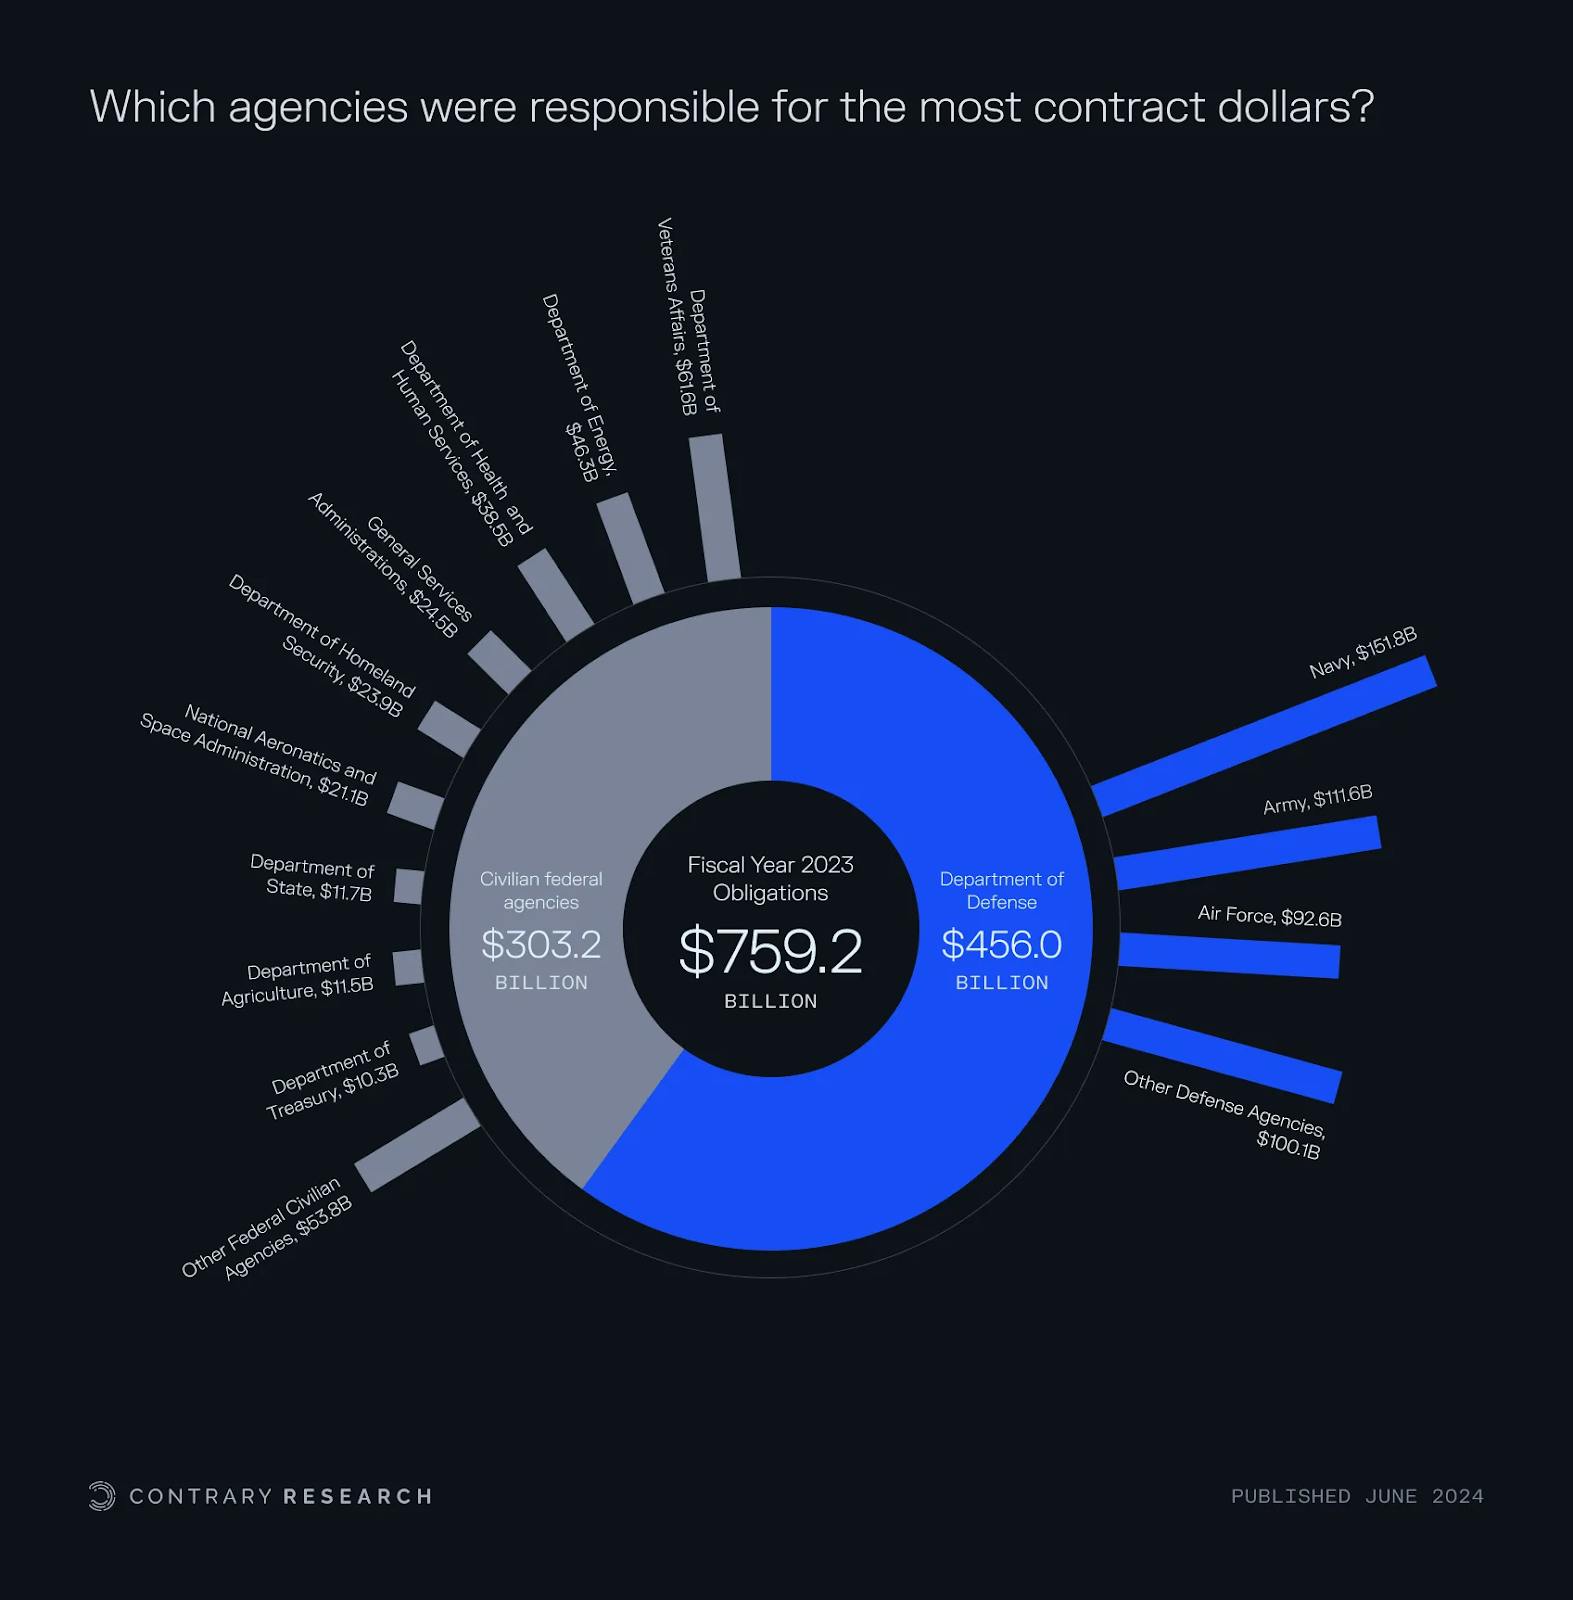
Source: GAO; Contrary Research
Across all of those vendors, a massive obstacle is that each agency has a silo of context around their interactions with particular vendors. Providing context is particularly hard across government departments because data is not well standardized or shared. Context has to extend beyond a single department, and coordination with other purchasers is a key part of that context.
Applying the Efficiency Formula to the US Government
There are dozens of examples of organizations that have applied the Efficiency Formula to their own drag baskets and have increased their organization’s velocity without requiring any additional resources.
For example:
Apple emphasizes efficiency in specific organizations so that operations don’t get more lax, like having a treasury team managing $230 billion of cash with just seven people. More control.
Quora has put parameters around investments in growth to ensure that expenses don’t scale as quickly as revenue, ensuring a sustainable business model. More velocity.
Just as the Efficiency Formula has enabled companies to increase velocity, it could do the same for a variety of government agencies. Across the $7.3 trillion federal budget in 2025, the government will end up spending billions of dollars across dozens of programs that will simply disappear. We’ll have little or no context around how it's being spent and virtually no control to ensure it's spent efficiently.
Instead, imagine a world where the Efficiency Formula isn’t just put into practice, but it's played out in real time.
Dashboard.gov: a Magnifying Glass on Government Inefficiency
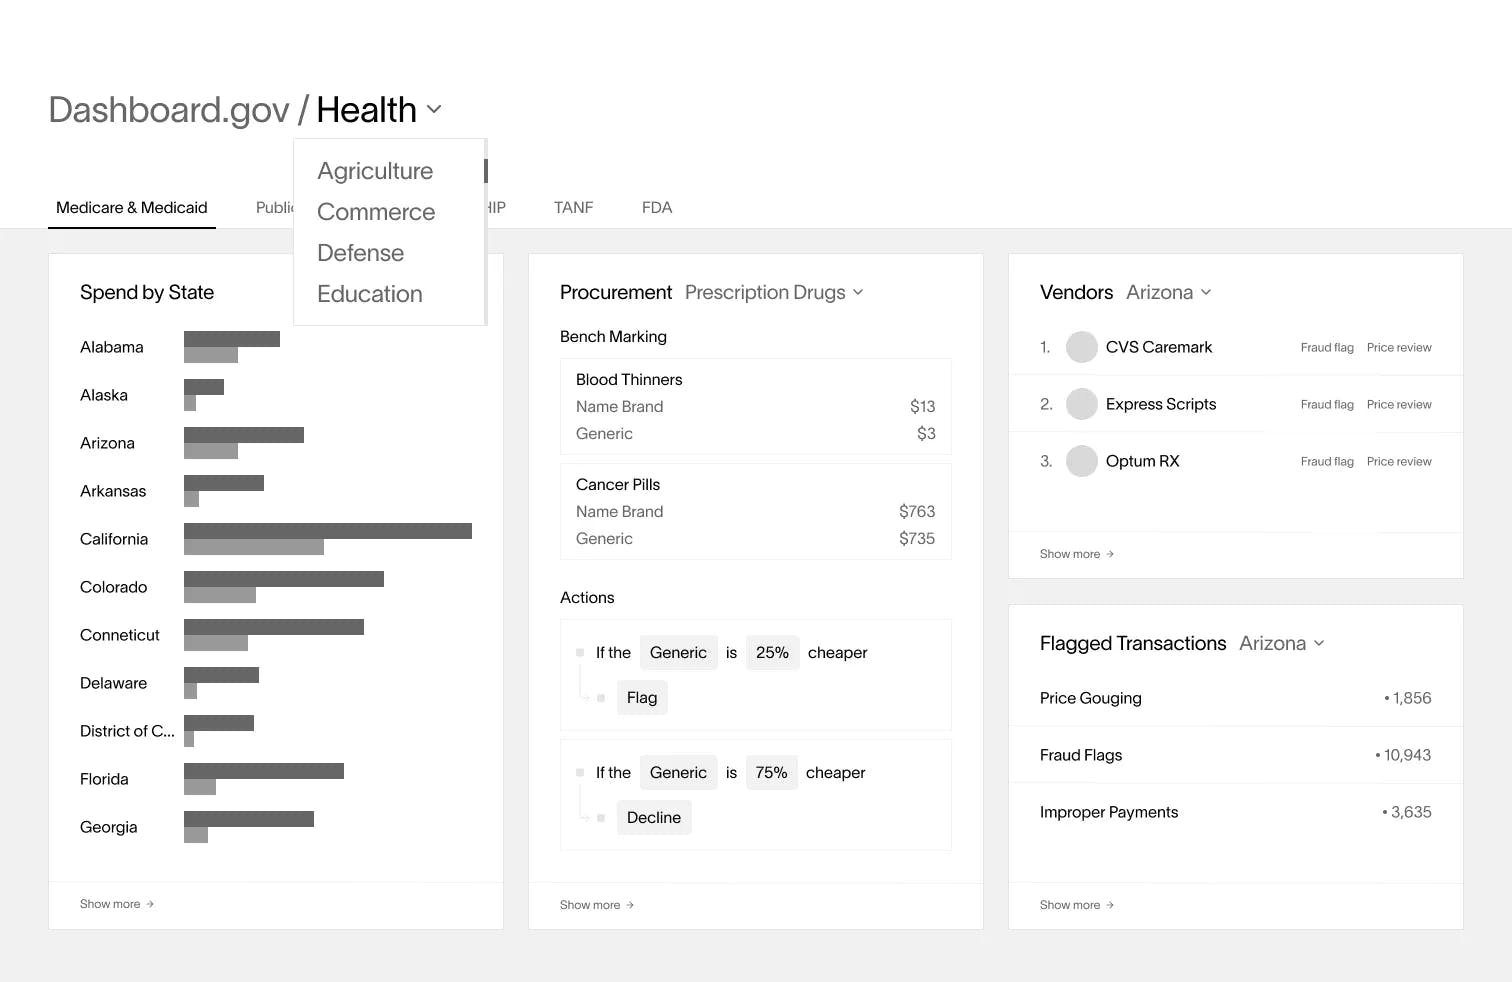
Source: Contrary Research; hypothetical and simplified government efficiency dashboard
Private market operators drive the majority of their business through data dashboards that can be customized in real time across all their transactions. Imagine a world where every department of the US government had the same real-time visibility at dashboard.gov. Just hit the right URL: dashboard.gov/defense or dashboard.gov/agriculture.
Think of it. Flagged spenders; didn’t we tell the Department of Transportation they couldn’t spend another $1 billion for 10 miles of trolley tracks? Exception requests; let’s make sure FEMA has more than enough spend on the card for each fire evacuation center. Flagged transactions; why is the National Institute of Health paying $500K for Russian labs to run experiments on cat brains?
The more context is made available, the more control we can start to extend.
We Need to Reignite American Efficiency
When America is at its best it can accomplish exceptional things, from airplanes to polio vaccines, from MRIs to personal computers. The rate at which America can increase its velocity is only limited by the thrust of resources available and the magnitude of drag holding us back. America’s GDP is already nearly 2x the next largest nation, while it collects almost $5 trillion of tax revenue. Earlier we mentioned how saving 1% on cost (drag) can have the same impact on an organization’s profitability as increasing revenue (thrust) by ~12%. The same is true of the United States. The highest ROI for increasing America’s velocity is to reduce our drag.
The Efficiency Formula is the framework purpose-built for America to go to war on waste, fraud, and abuse. The more efficient American government becomes, the more capable it will be of lifting the quality of life for everyone within its influence. But efficiency doesn’t just happen. It requires context, control, and accountability.
*Contrary is an investor in Ramp through one or more affiliates.