

Thesis
Data is increasingly becoming a key competitive advantage for companies across industries. Over the last two decades, the drastic increase in corporate cloud data volumes and the emergence of tools for data transformation, model-building, and visualization have led to the rise of the modern data stack. The global data analytics market size was valued at $241 billion in 2021 and is projected to grow to $656 billion by 2030. Meanwhile, data science employment is projected to grow 36% from 2022 to 2031, faster than the average growth rate for all occupations at 5%. Companies are ramping up investment in data teams to analyze, predict, and adapt to changing business needs.
However, existing tools for data scientists and analysts have often fallen short of user needs. Sharing and publishing data work has been an area of difficulty. Data practitioners typically jump between multiple tools, such as Jupyter Notebook, SQL scratchpad, or Google Docs. Compounding this issue, more companies are requiring data literacy for their non-technical users (e.g. product management, finance, and business operations). Traditional data notebooks have a steep learning curve and are not friendly to the average data consumer. This has been exacerbated by the growth of workloads, causing issues for collaboration, sharing, and productivity, making the need for a modern data platform increasingly clear.
Hex is making a bid to serve this need. Hex is a collaborative data workspace that allows technical and non-technical users to analyze data, collaborate, and share work as interactive data apps. Data work once squarely lived within data teams, but with rising data literacy across organizations, Hex wants to make data workspaces more accessible through its intuitive user interface (UI), real-time collaboration, data stack integrations, no-code charts, graph-based compute engine, and more. Hex’s product has been built with a “low floor, high ceiling” approach, with the goal of empowering and connecting users across the spectrum of technical ability.
Founding Story

Source: Hex
Hex was founded in 2019 by co-founders Barry McCardel (CEO), Caitlin Colgrove (CTO), and Glen Takahashi (Chief Architect) who first met while working at Palantir.
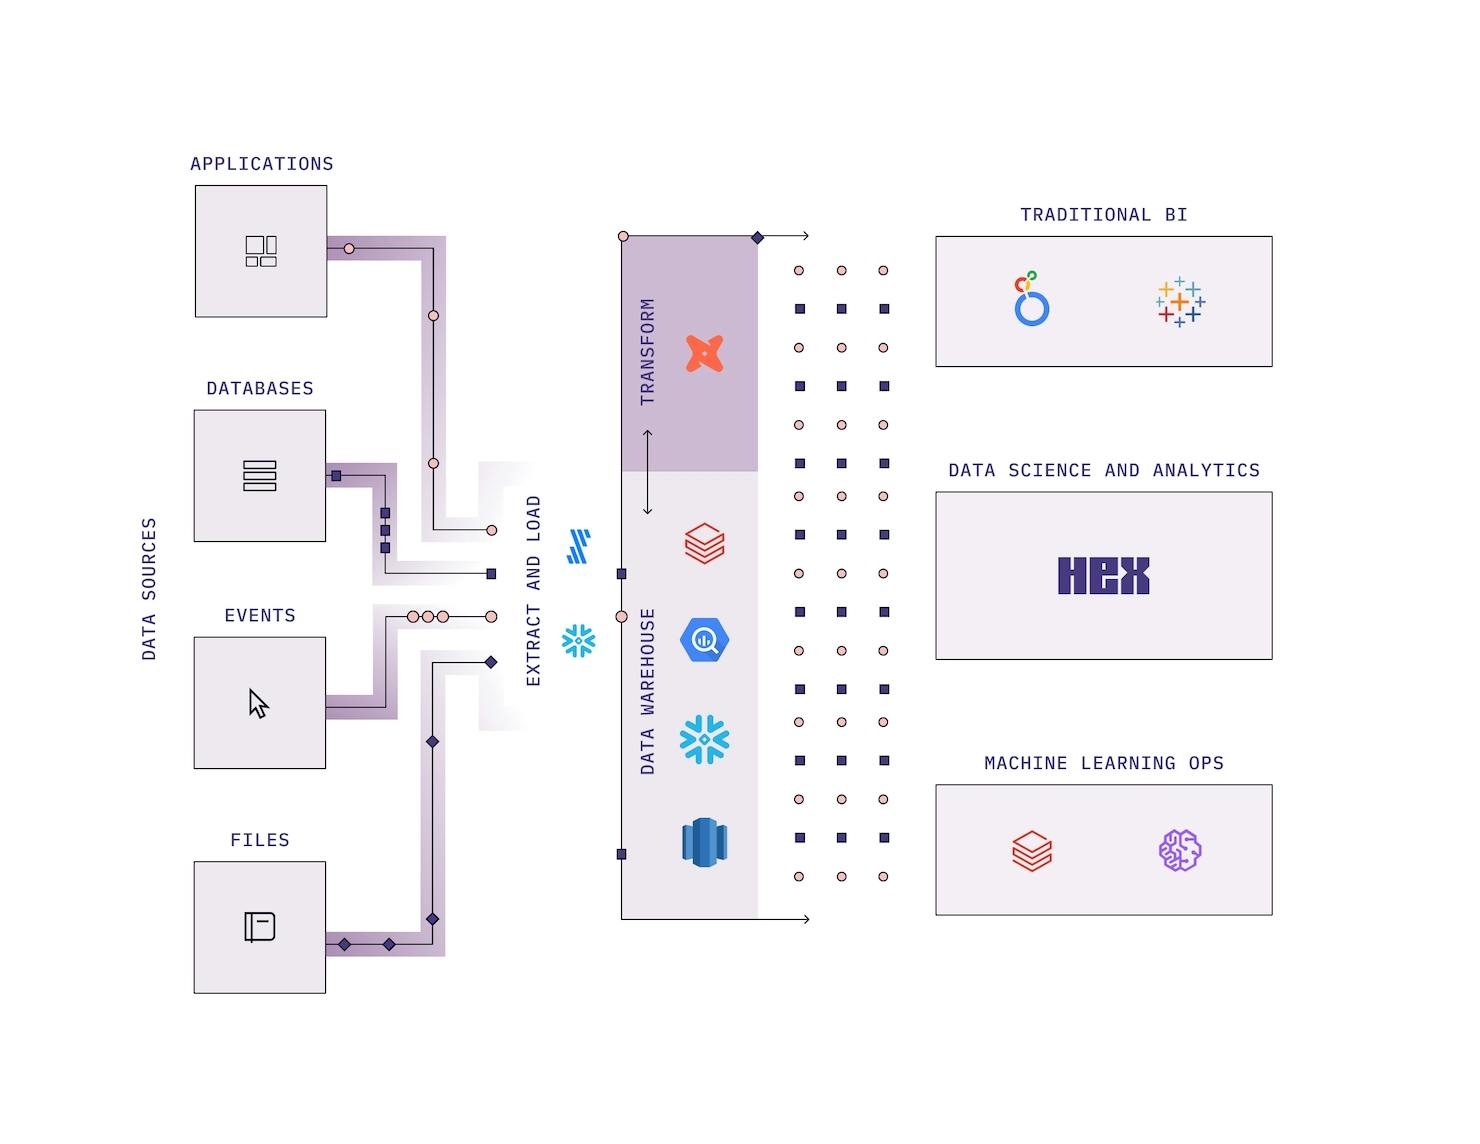
During that time, the team noticed a rapid increase in data volumes and tools for data transformation, model-building, and visualization. The rise of cloud data warehouses enabled companies to store data at scale and increase the volume of accessible data. Companies like Snowflake and Databricks made it easy to extract data into warehouses. dbt Labs and Fivetran enabled companies to transform that data into a usable state. The modern data stack was taking shape.
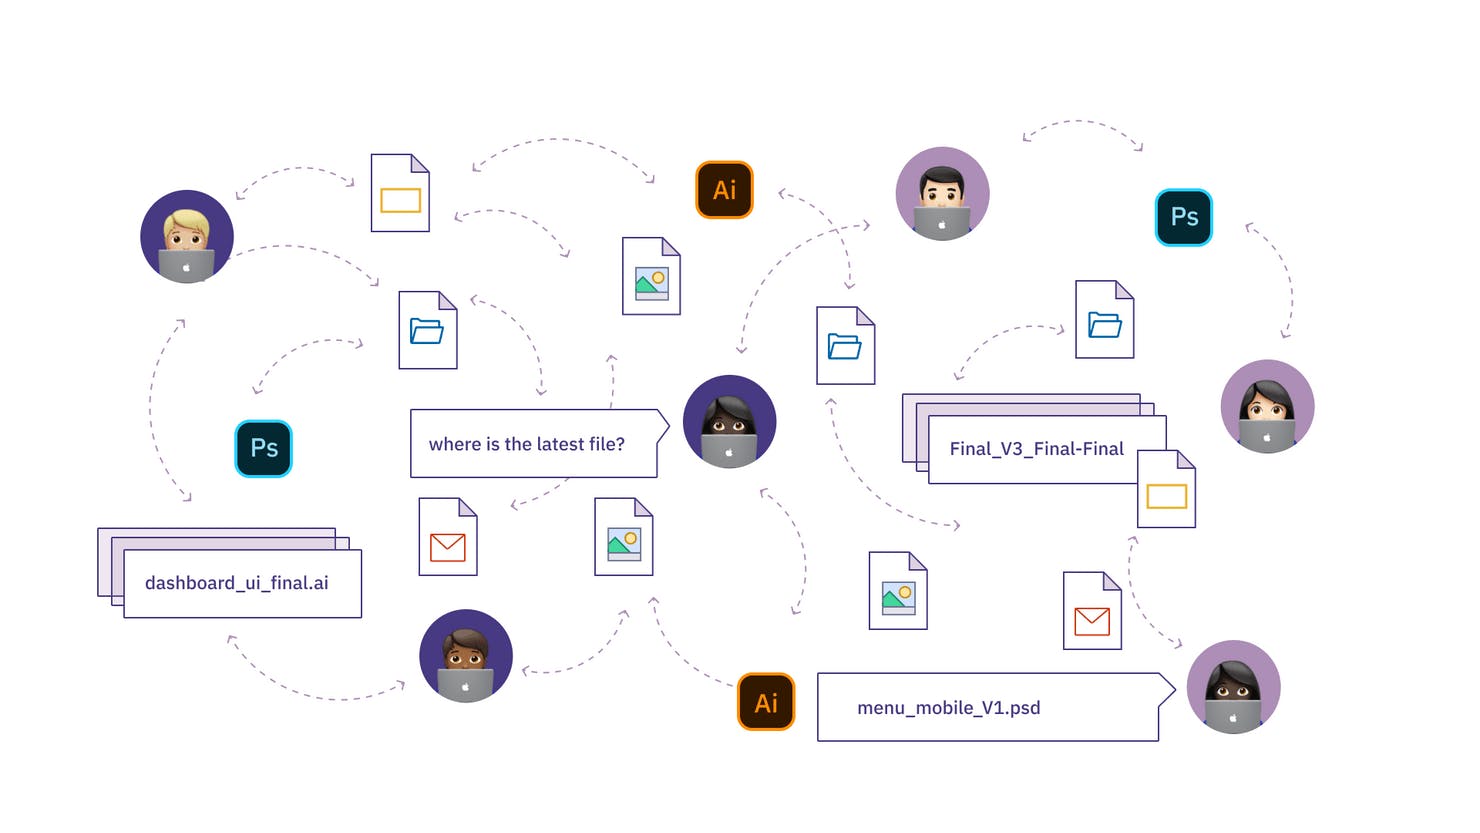
However, across their experiences, the team encountered the same problem: it was very difficult to share and publish data work. Data practitioners would spend a lot of time writing one-off SQL queries, working in local Python notebooks, screenshotting charts out of a local Jupyter Notebook or SQL scratchpad, and pasting them in Google Docs. Others might export a CSV from a business intelligence (BI) tool just to build it into a deck. Workflows were woefully siloed, and collaboration was suboptimal.
Source: Hex
In other words, existing data workspace tools were not built for modern collaboration. There was room in the market to do for data users what Figma did for designers, and what Notion did for documentation. Recognizing this, the team founded Hex with the goal of bringing together the best of notebooks and data visualization into a single collaborative platform.
The company takes a “low floor, high ceiling” approach in its product. As McCardel puts it:
“Truly empowering users doesn’t mean getting rid of code, but embracing it. The beauty of code is its infinite flexibility, and the tools of the future should unleash, not constrain, a users’ creativity.”
By making code-based workflows more accessible and connecting users across the technicality spectrum, Hex enables enables stakeholders to ask and answer questions, work together, and build knowledge. With this, Hex intends to become the “frontend for the modern data stack.”
Source: Hex
Product
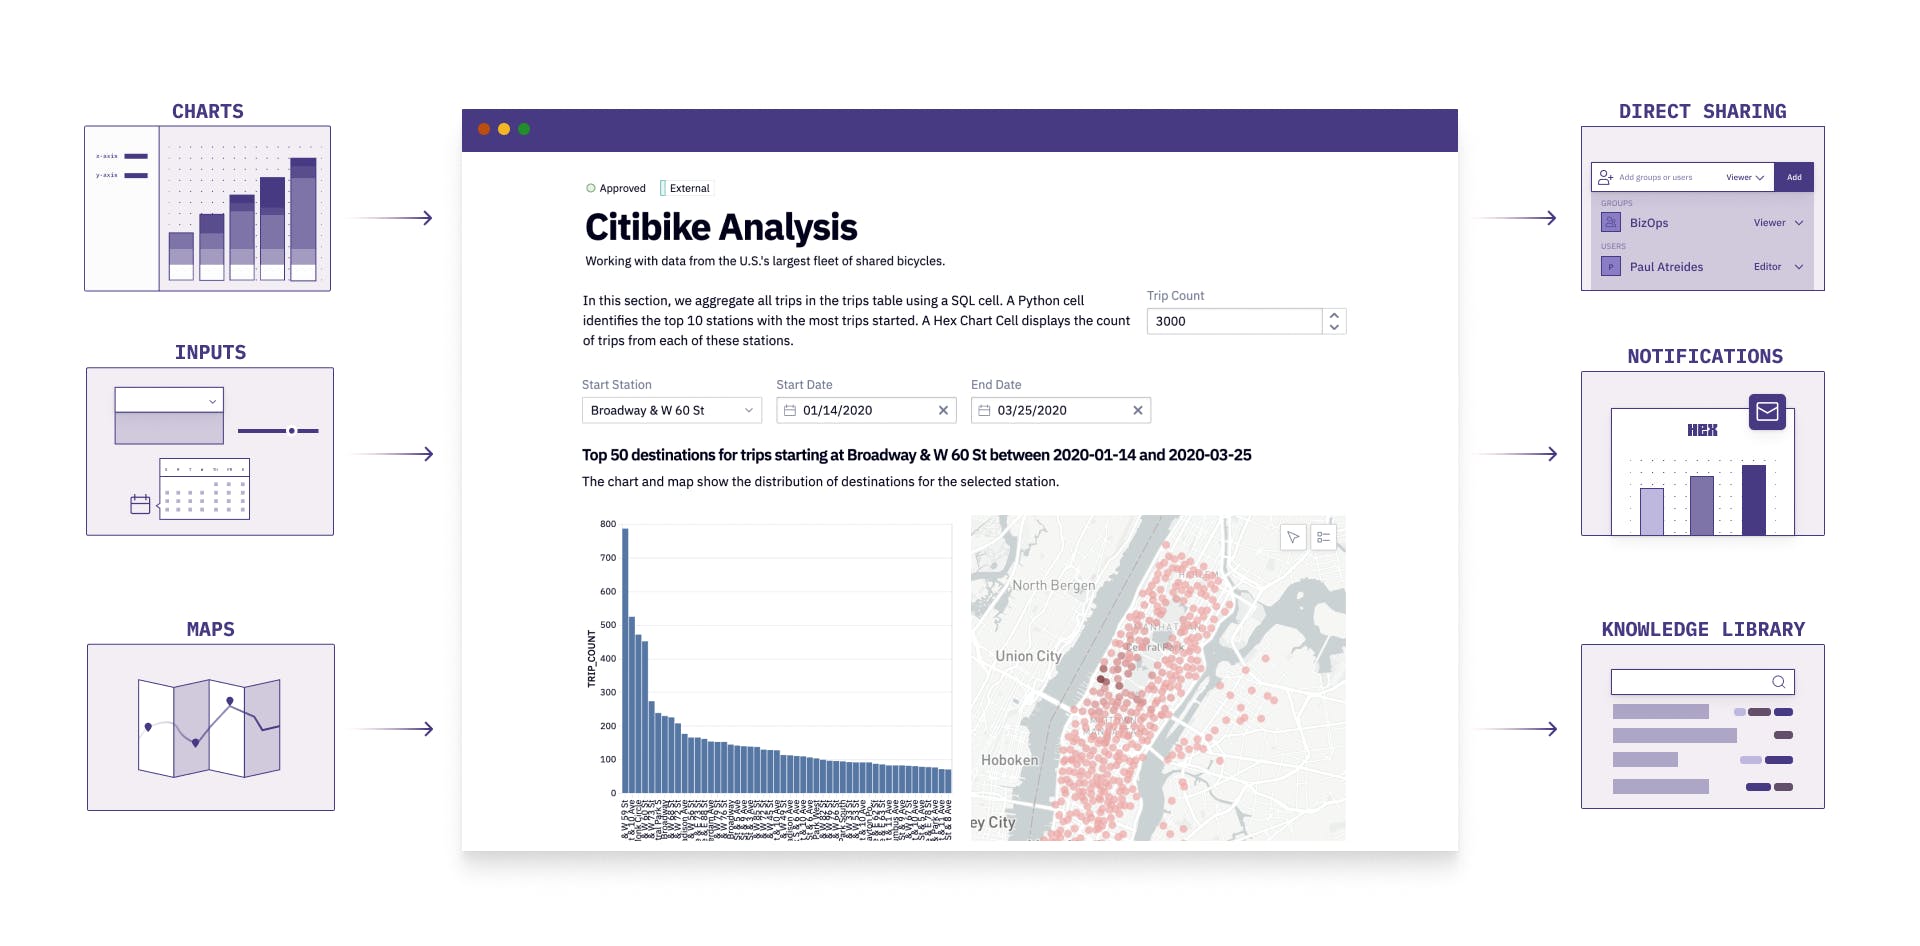
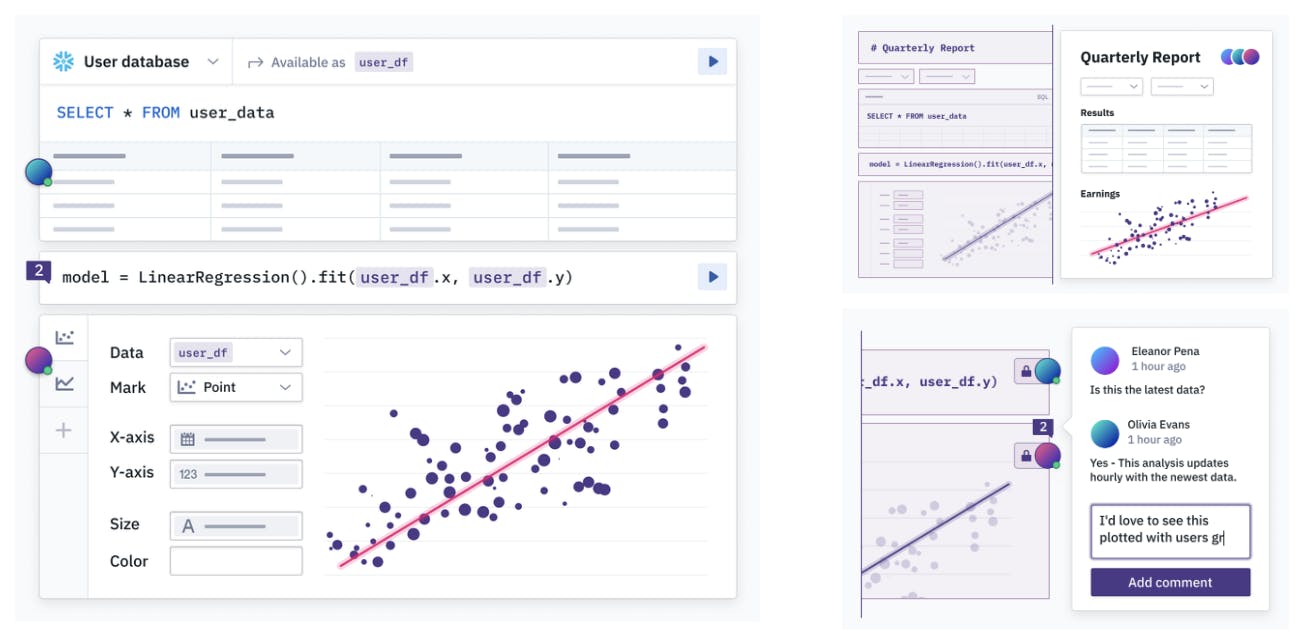
The Hex platform is a modern collaborative workspace for data science and analytics, meant to equip teams to more seamlessly move from idea to insight to sharing. The platform aims to help users more easily connect to data, analyze it in collaborative SQL and Python-powered notebooks, and share work as interactive data apps and stories. Key features include real-time collaboration, no-code charts, and a reactive, graph-based compute engine.
Source: Hex
The status quo without a platform like Hex is usually for data scientists and analysts to jump between multiple tools. This fragmentation causes issues for collaboration, sharing, and productivity. Hex aims to eliminate this user friction to enable data teams to focus on their work.
Hex’s platform has three major elements:
Logic View: A notebook-based interface where users can develop analysis.
App Builder: An interface builder, where users can arrange elements from the Logic View into an interactive app where viewers can explore data and make comments.
Share: A functionality that allows users to invite stakeholders, customers, and team members to collaborate on and interact with analysis.
Source: Hex
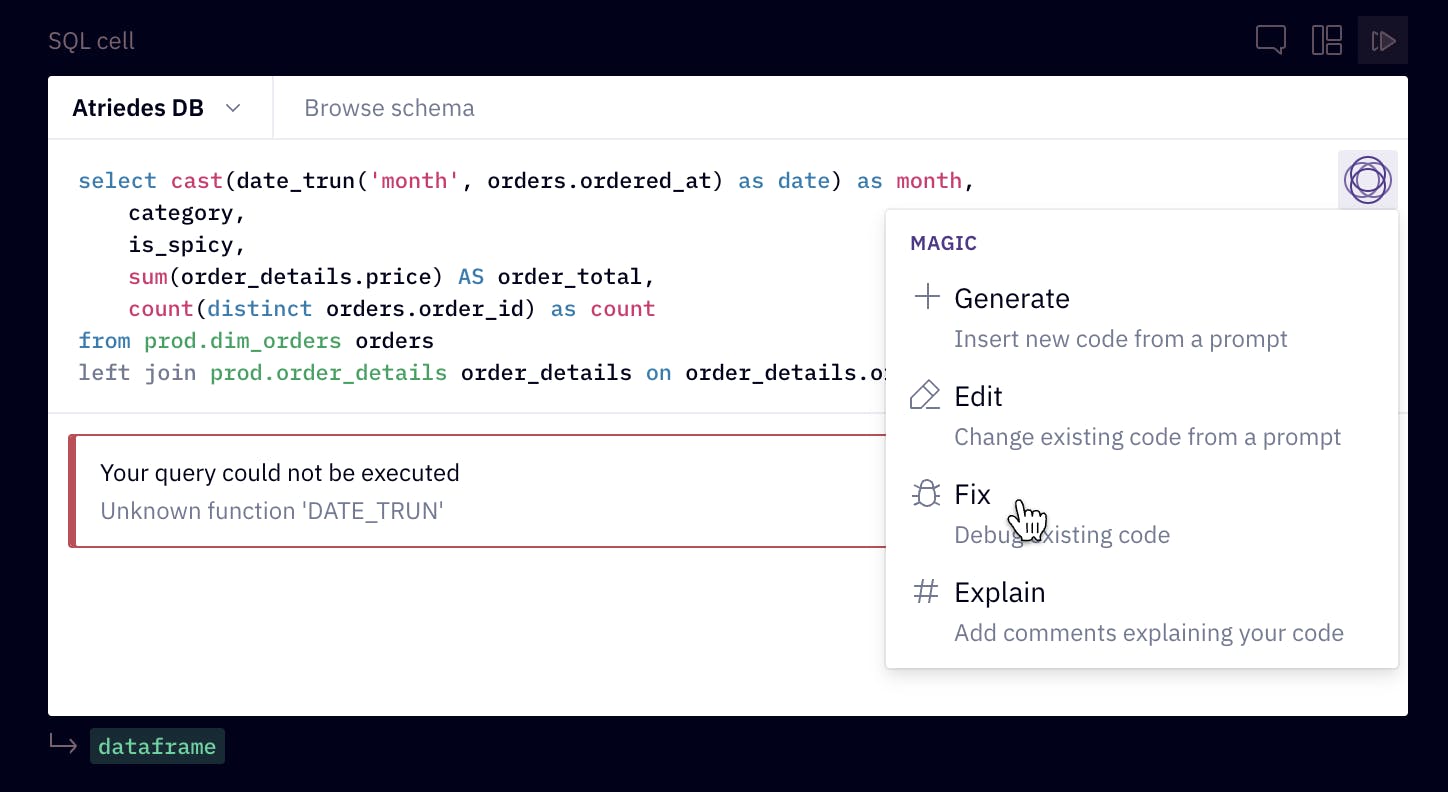
Hex Magic
In February 2023, Hex announced the private beta of Hex Magic, a generative AI assist tool. With Magic, Hex is able to understand and use a schema’s end tables to build queries. Current features include auto-querying, debugging, and code explanations. However, Hex affirms that this offering does not equate to “instant insights in a box.” While AI capabilities are great, they cannot replace human insight and judgment. AI can help alleviate tedious tasks, but it does not yet fully understand business context, know the right questions to ask, or how to present cohesive answers.
In a March 2023 interview with Contrary Research, Hex CEO McCardel described his perspective:
“With the rise of generative AI and the modern data stack, people sometimes feel that these tools will dissolve a data team or democratize away the value of a data team. But I actually think it will amplify the data teams, and let them get much more done in their day. It will give them more time to focus on important things, rather than just the plumbing. The real job of a data analyst is to understand business context and form and text hypotheses. It’s a genuinely creative role.”
Source: Hex
Integrations
Hex has built 20+ integrations with companies across the data stack, bringing popular tools, languages, and data sources together into their platform. Categories include (1) storage and compute, (2) metadata and metrics, (3) code sync and versioning, and (4) orchestration and workflows. Notable partnerships include integrations with dbt Labs, Snowflake, Databricks, GitHub, and Apache Airflow.

Source: Hex
Use Cases
The Hex platform serves three core use cases:
Exploratory Analysis: Exploratory and ad-hoc analyses to answer questions.
Data Science: The ability to combine rich text, interactivity, and live visualizations.
Reporting: Dashboards and data storytelling.
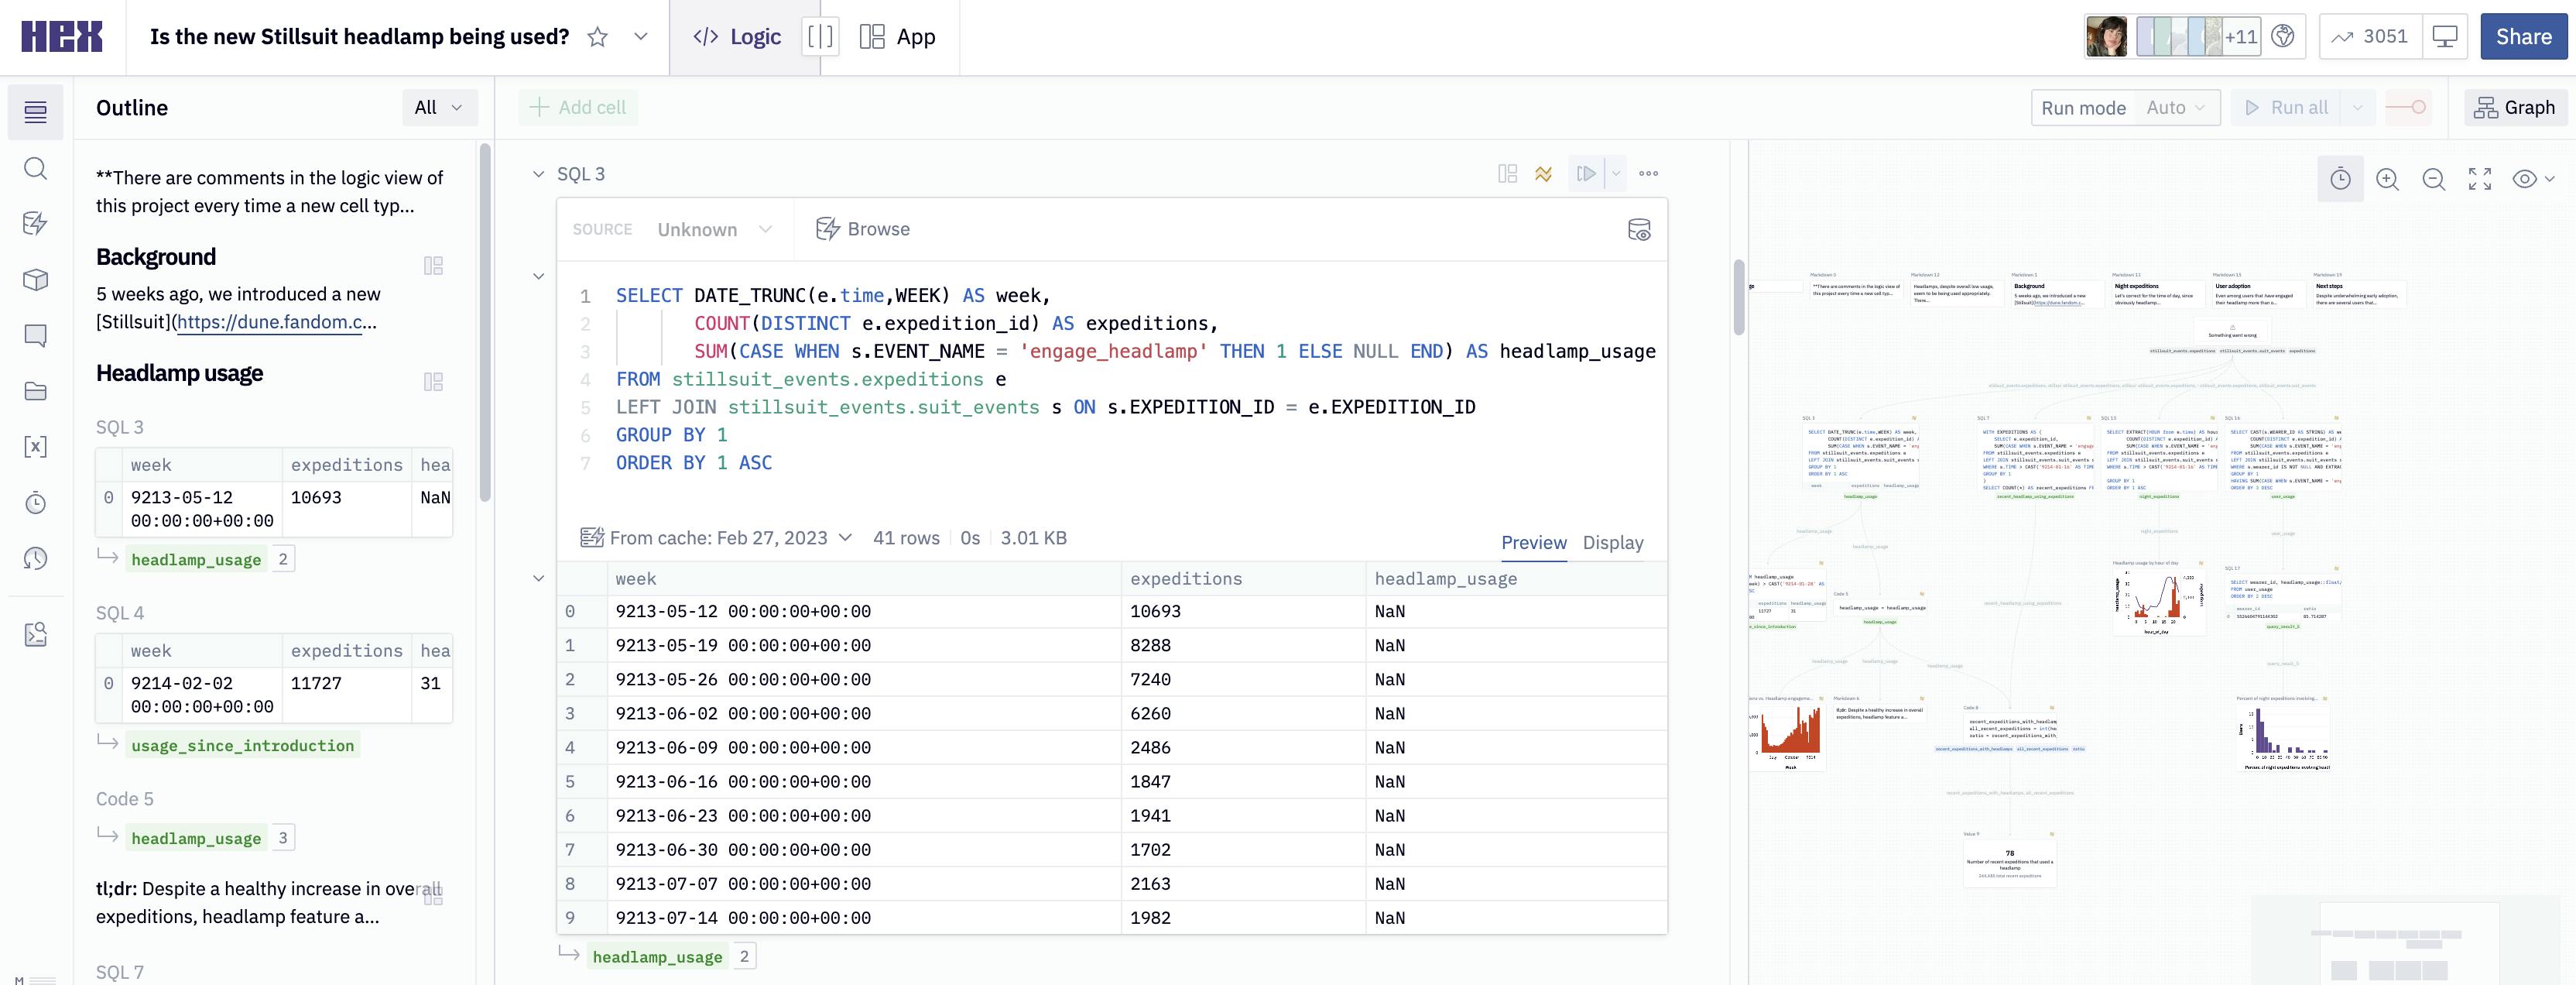
Exploratory Analysis
Key functions include:
Ad-hoc Exploration: Data practitioners and cross-functional stakeholders can document a question, supporting analysis, charts, and conclusions within a single UI.
Exploratory Data Analysis (EDA): EDA is the process of investigating data to understand its structure, find any missing values or outliers, or provide insight into unknown relationships.
SQL Notebooks: Users can chain SQL queries, join across data sources, and access cloud-scale data in a collaborative SQL integrated development environment (IDE).
No-code Notebooks: Hex's library of no-code cells can make charts, transform data, and build interactive data apps without the user having to write a single line of code.
Polyglot Notebooks: All of Hex’s applications are polyglot by default. Users can use SQL, Python, and no-code tools directly in the same workspace without having to switch tools.
Interactive Data Stories: Build long-form analysis using SQL, Python, or no-code, and publish reports for end users. Data is synced to warehouses in real time.
Source: Hex
Data Science
Key functions include:
A/B Testing: Query data from a database with SQL, clean and balance it in Python, then visualize the difference between segments or perform a hypothesis test to find statistically significant results.
dbt Audit Helper: Streamline analytics engineering workflows with an easy-to-use interface to the dbt-audit-helper package, complete audit traceability, and records.
ML Model Development: Development environment for prototyping and deploying predictive models in a single interface with direct SQL access to data warehouses, a polyglot environment, and a built-in app builder.
Natural Language Processing (NLP): Build an NLP app that uses Hex, Hugging Face, and a TF-IDF model to do sentiment analysis, emotion detection, and question detection on natural language text.
Time Series Forecasting: Connect directly with data warehouses to build predictive time series models in Python and SQL.
Data Science with Snowpark: Get started with Snowpark for Python, with built-in environments and helper functions to create new Snowpark sessions. Snowpark is a developer framework that brings native SQL, Python, Java, and Scala support to Snowflake for fast and collaborative development across data teams.
Source: Hex
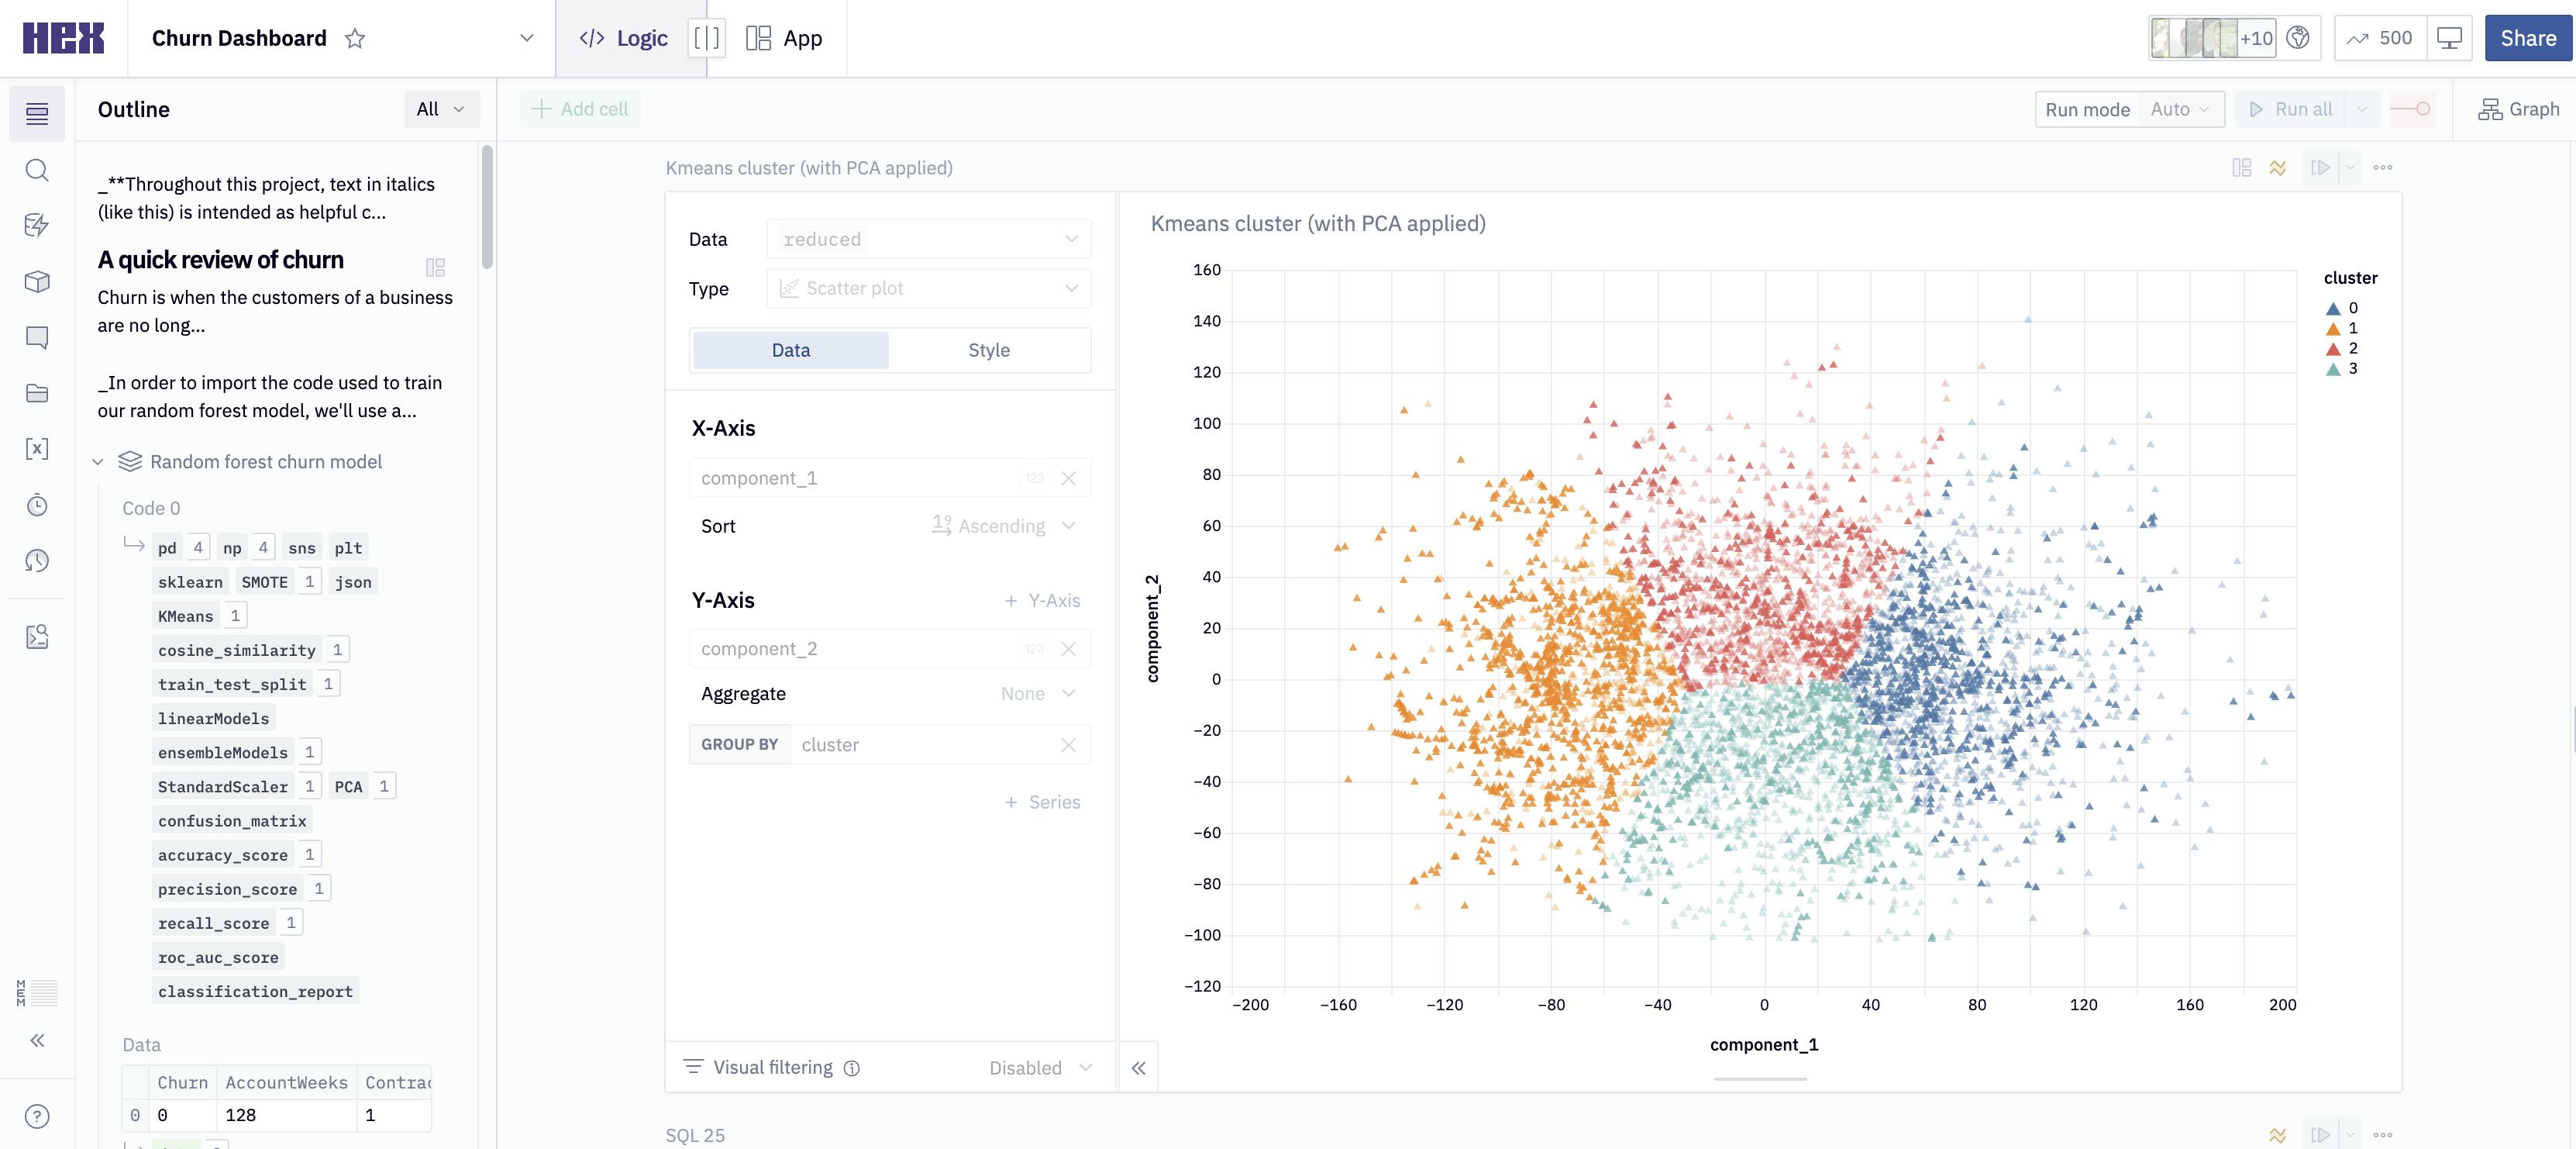
Reporting
Key functions include:
Customer Churn Dashboard: This feature lets users build an interactive frontend for any ML model using Hex. Users can use a rich library of cells to accept user input, create visualizations, or take actions based on model outputs.
dbt Metrics: Query governed data from a querying interface built on top of the dbt metrics Layer. Define metrics in dbt, then query, pivot, and visualize in Hex.
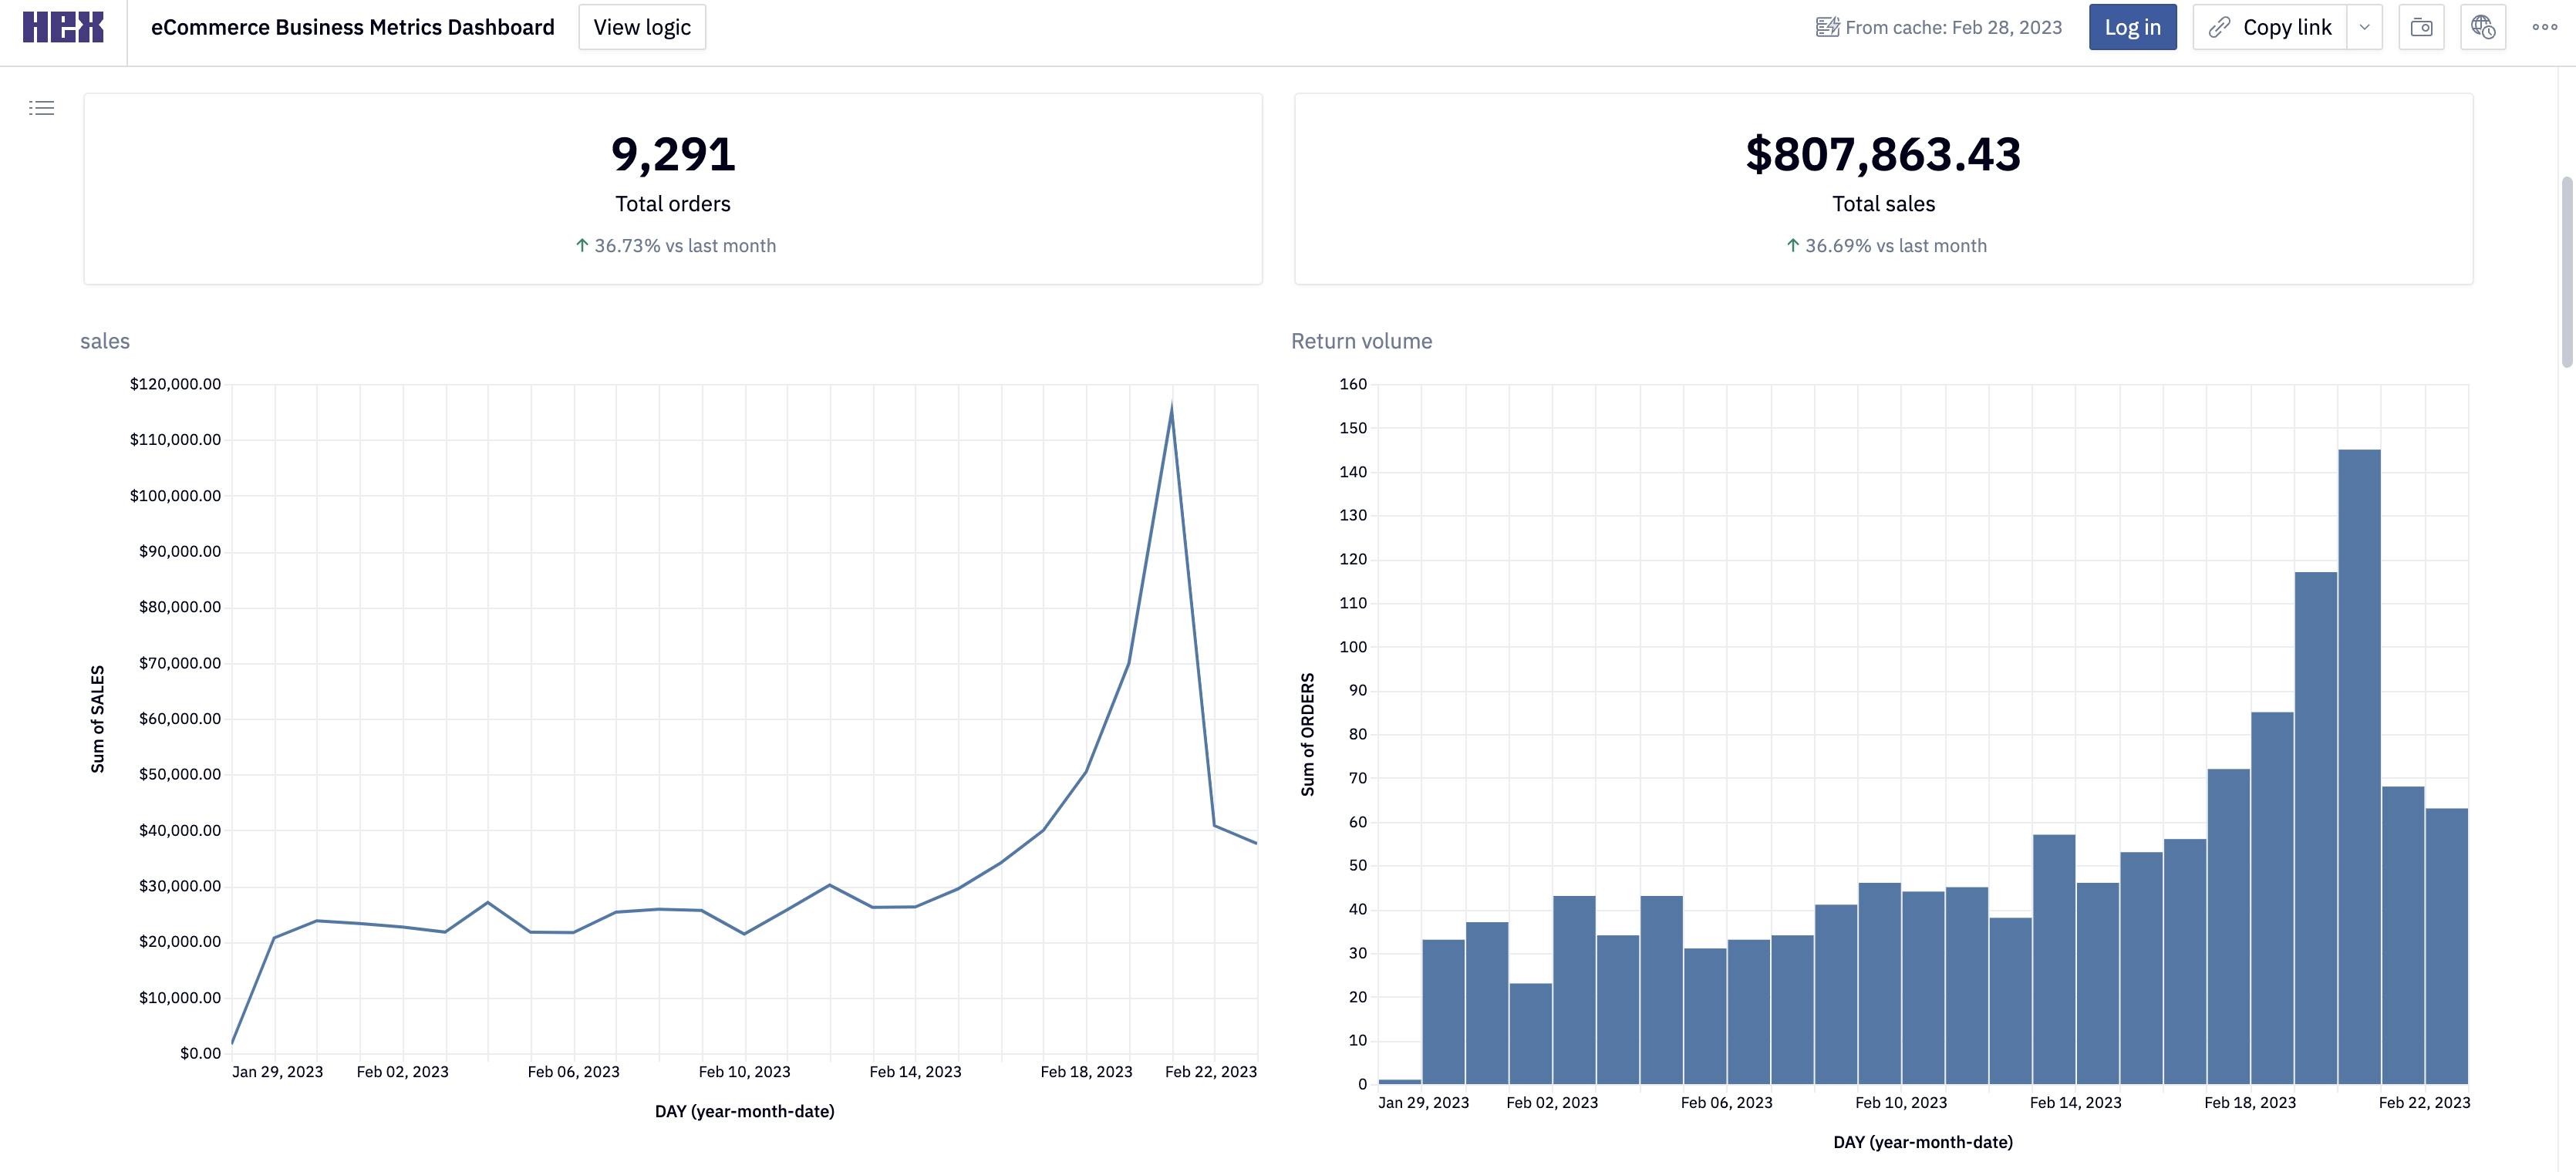
Company Metrics Dashboard: Turn flexible and complex analyses into easy-to-use dashboards.
SQL Powered Dashboards: Turn SQL queries into production dashboards with a flexible report builder.
Source: Hex
Market
Customer
Hex’s customers are primarily data practitioners (e.g. data scientists and data analysts), but the company supports the broader population of the “analytically technical” as well. This includes people in product management, business operations, or finance organizations since these are areas where personnel are not classically trained in data but are still data literate.
Both user bases are growing rapidly. The number of job postings for roles that include “data” in the job title grew 135% from 2017 to 2021. Going forward, data science employment is projected to grow 36% from 2022 to 2031, faster than the average growth rate for all occupations at 5%. But data practitioners are not the only ones in demand. Many descriptions for jobs outside of data teams now require analytical skills.
There is a growing population of non-technical users who are proficient in SQL/Python or have had experience “pseudo-coding” in Excel. To put it more broadly, anyone who works with and needs to present data has experienced pain points that they can solve using Hex.
Market Size
The global data analytics market size was valued at $241 billion in 2021 and is projected to grow to $656 billion by 2030 (representing a 13.4% CAGR from 2022 to 2029). Key drivers of growth include (1) the growing application of data analytics tools for forecasting, (2) the ongoing shift to public cloud, and (3) the rise of AI and ML within enterprise applications. While macroeconomic headwinds may temper spend, uncertainty could also drive demand for data-driven decision making and the use of technology to more efficiently achieve business goals.
In addition, adoption of cloud data warehouses has grown sharply in the decade leading up to 2023. From 2015 to 2022, the share of corporate data stored in the cloud grew from 30% to 60%, respectively. Cloud infrastructure spend grew to $90 billion in 2022 (22% YoY growth from 2021), representing the highest annual growth rate since 2018. With the rapid growth of cloud data platforms coupled with the proliferation of ETL and data maintenance tools, it’s becoming easier than ever to adopt and maintain a cloud data warehouse.
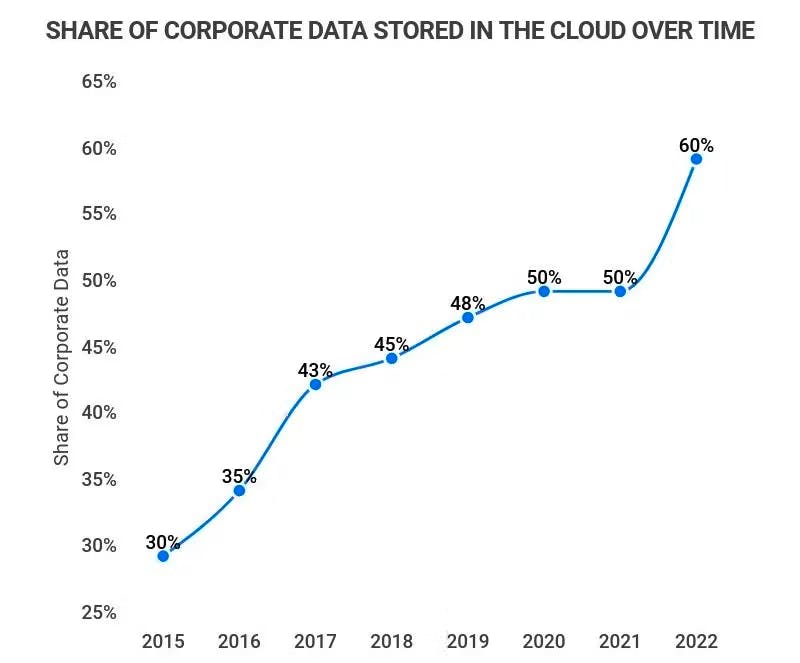
Source: Statista
More data for cloud data platforms increases demand for tools like Hex that make the querying process seamless and collaborative. Hex CEO McCardel stated that:
“Hex sits on top of those environments — on top of Snowflake and on top of Databricks — and helps customers make the most of the data that are in those environments. If you have brought all of your data into a data warehouse, including both of those two, often the next question is: so what now? How do I make this useful and impactful for the organization? Hex really seeks to answer that question.”
As data volumes grow, so does the opportunity for data science. The data science platform market size was valued at $93 billion in 2021 and is projected to grow to $323 billion by 2026 (27.7% CAGR from 2022-2026). Hex’s product today primarily covers data workspace and data visualization. However, it may benefit from greater adoption as companies become increasingly reliant on data manipulation to analyze, predict, and adapt to changing business needs.
Competition
Data infrastructure is highly complex with many legacy players and new entrants all across the stack. Hex’s competitors lie mainly in two broad categories of workflows: (1) data modeling and analysis and (2) data output. Hex must compete with many competitors in these highly fragmented markets, where many companies are seeking to become the dominant player in their part of the stack.
Some of the key names that Hex competes against within its existing product segments include:
Data Visualization (for Org-Wide Use and Reporting): Looker, Mode, Tableau
Traditional Notebooks (for Data Professionals): Google Colab, Amazon SageMaker, RStudio, JupyterHub, Databricks Notebooks, Snowflake
Collaboration-Focused Notebooks (for Data Professionals & Data Users): DeepNote, Observable, Noteable
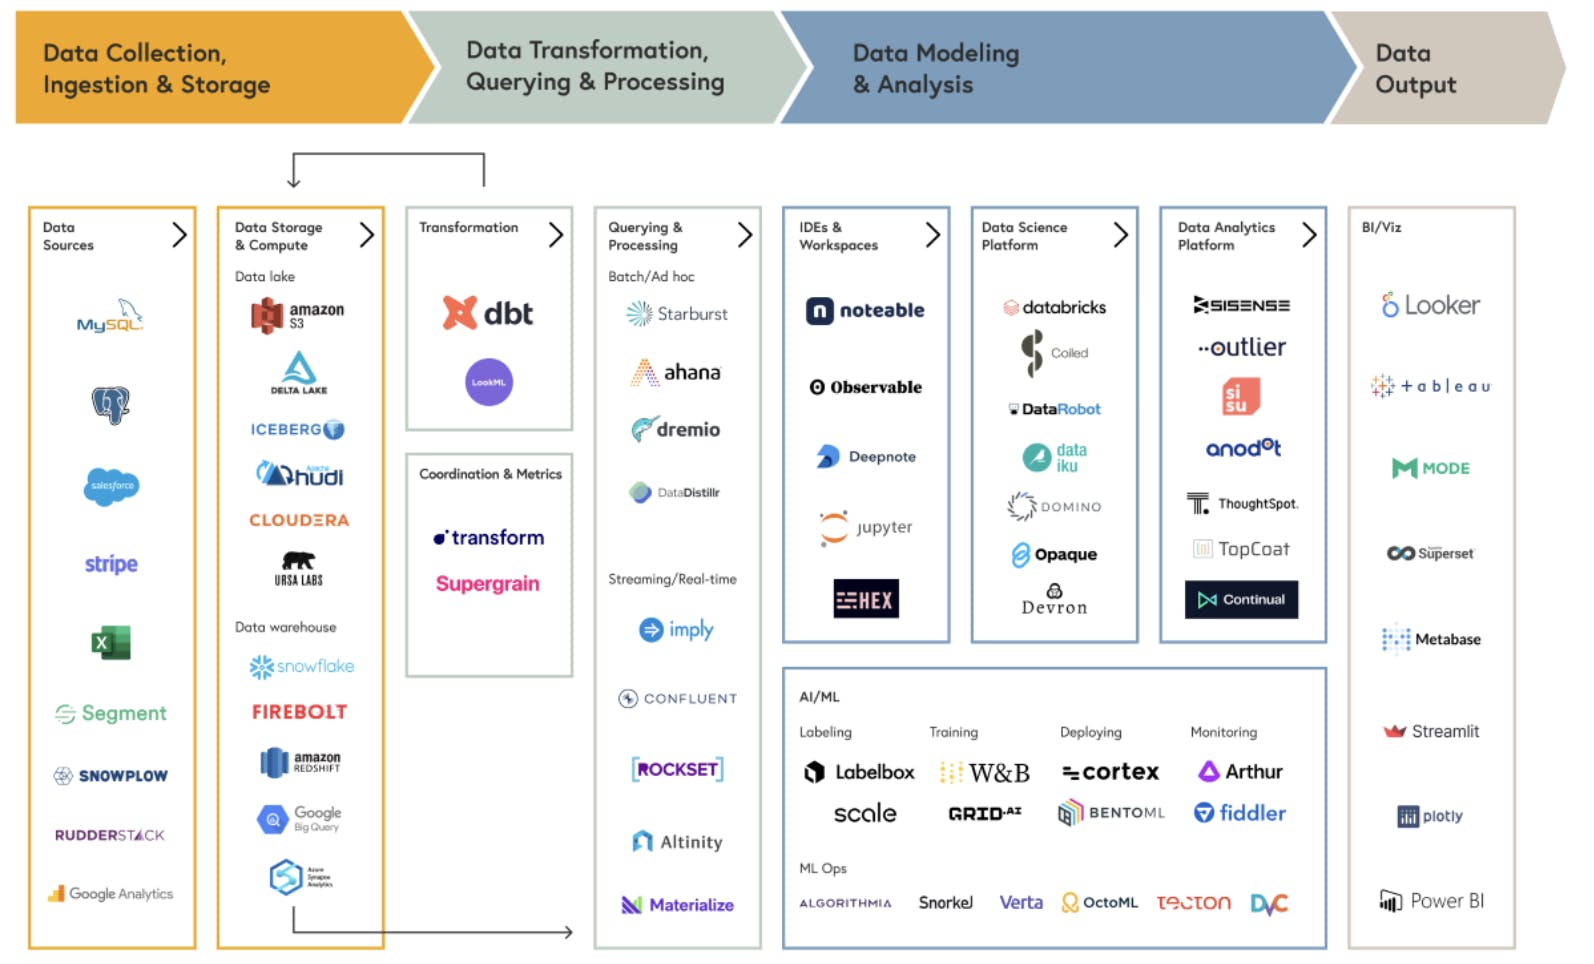
Source: Bessemer
Data Visualization
These products are traditionally used by data-savvy users to create dashboards and reports that will be routinely viewed by teams across the broader organization (i.e. not just the data organization). For example, Mode describes itself as the following: “Mode becomes a central hub full of easy-to-understand data, curated by the data team, without long implementation times or tedious maintenance.” Hex also aims to deliver the same value proposition. Features that may determine who wins amongst this group include ease of use, implementation, and maintenance.
Traditional Notebooks
For data scientists, notebooks are a crucial tool. These workspaces run interactive computing, where users can write and execute code, visualize results, and share insights. However, many traditional notebooks only offer basic, mostly single-player environments for doing data analysis. Hex offers the same basic notebook functionality, but with many additional features geared towards increasing ease-of-use, such as separating between the concepts of “code” and “application,” accessible viewing of database schemas, and a “cell” based system that allows for the easy linking and recycling of different queries and scripts.
Collaboration-Focused Notebooks
Collaboration-focused notebooks offer the same notebook functionality as the legacy traditional notebook tools but focus on enabling multi-player use cases. An analogy might be Google Docs for data analysts doing data analysis together. Collaboration is a key need for many teams. Like Hex, these players support live, concurrent editing workflows.
As described above, the data space is still highly fragmented. There does not yet exist a strong, dominant solution that bridges the workflow gap between hardcore data scientists and less technical business analysts. The most widely adopted BI tools do not support Python or notebook style analysis (Tableau, Looker), and the most widely adopted notebook tool (Jupyter) was not built to be collaborative or to create shareable outputs (dashboard and apps).
Hex seeks to fill this gap in a similar way to how Figma brought together designers and stakeholders to tackle design work collaboratively. McCardel explicitly communicated a vision of Hex that was not just a tool for “high-end data scientists,” but a place for engineers, product managers, business analysts, and data scientists to work collaboratively. If Hex can do for data what Figma did for design, then it could unlock a large market opportunity.
Business Model
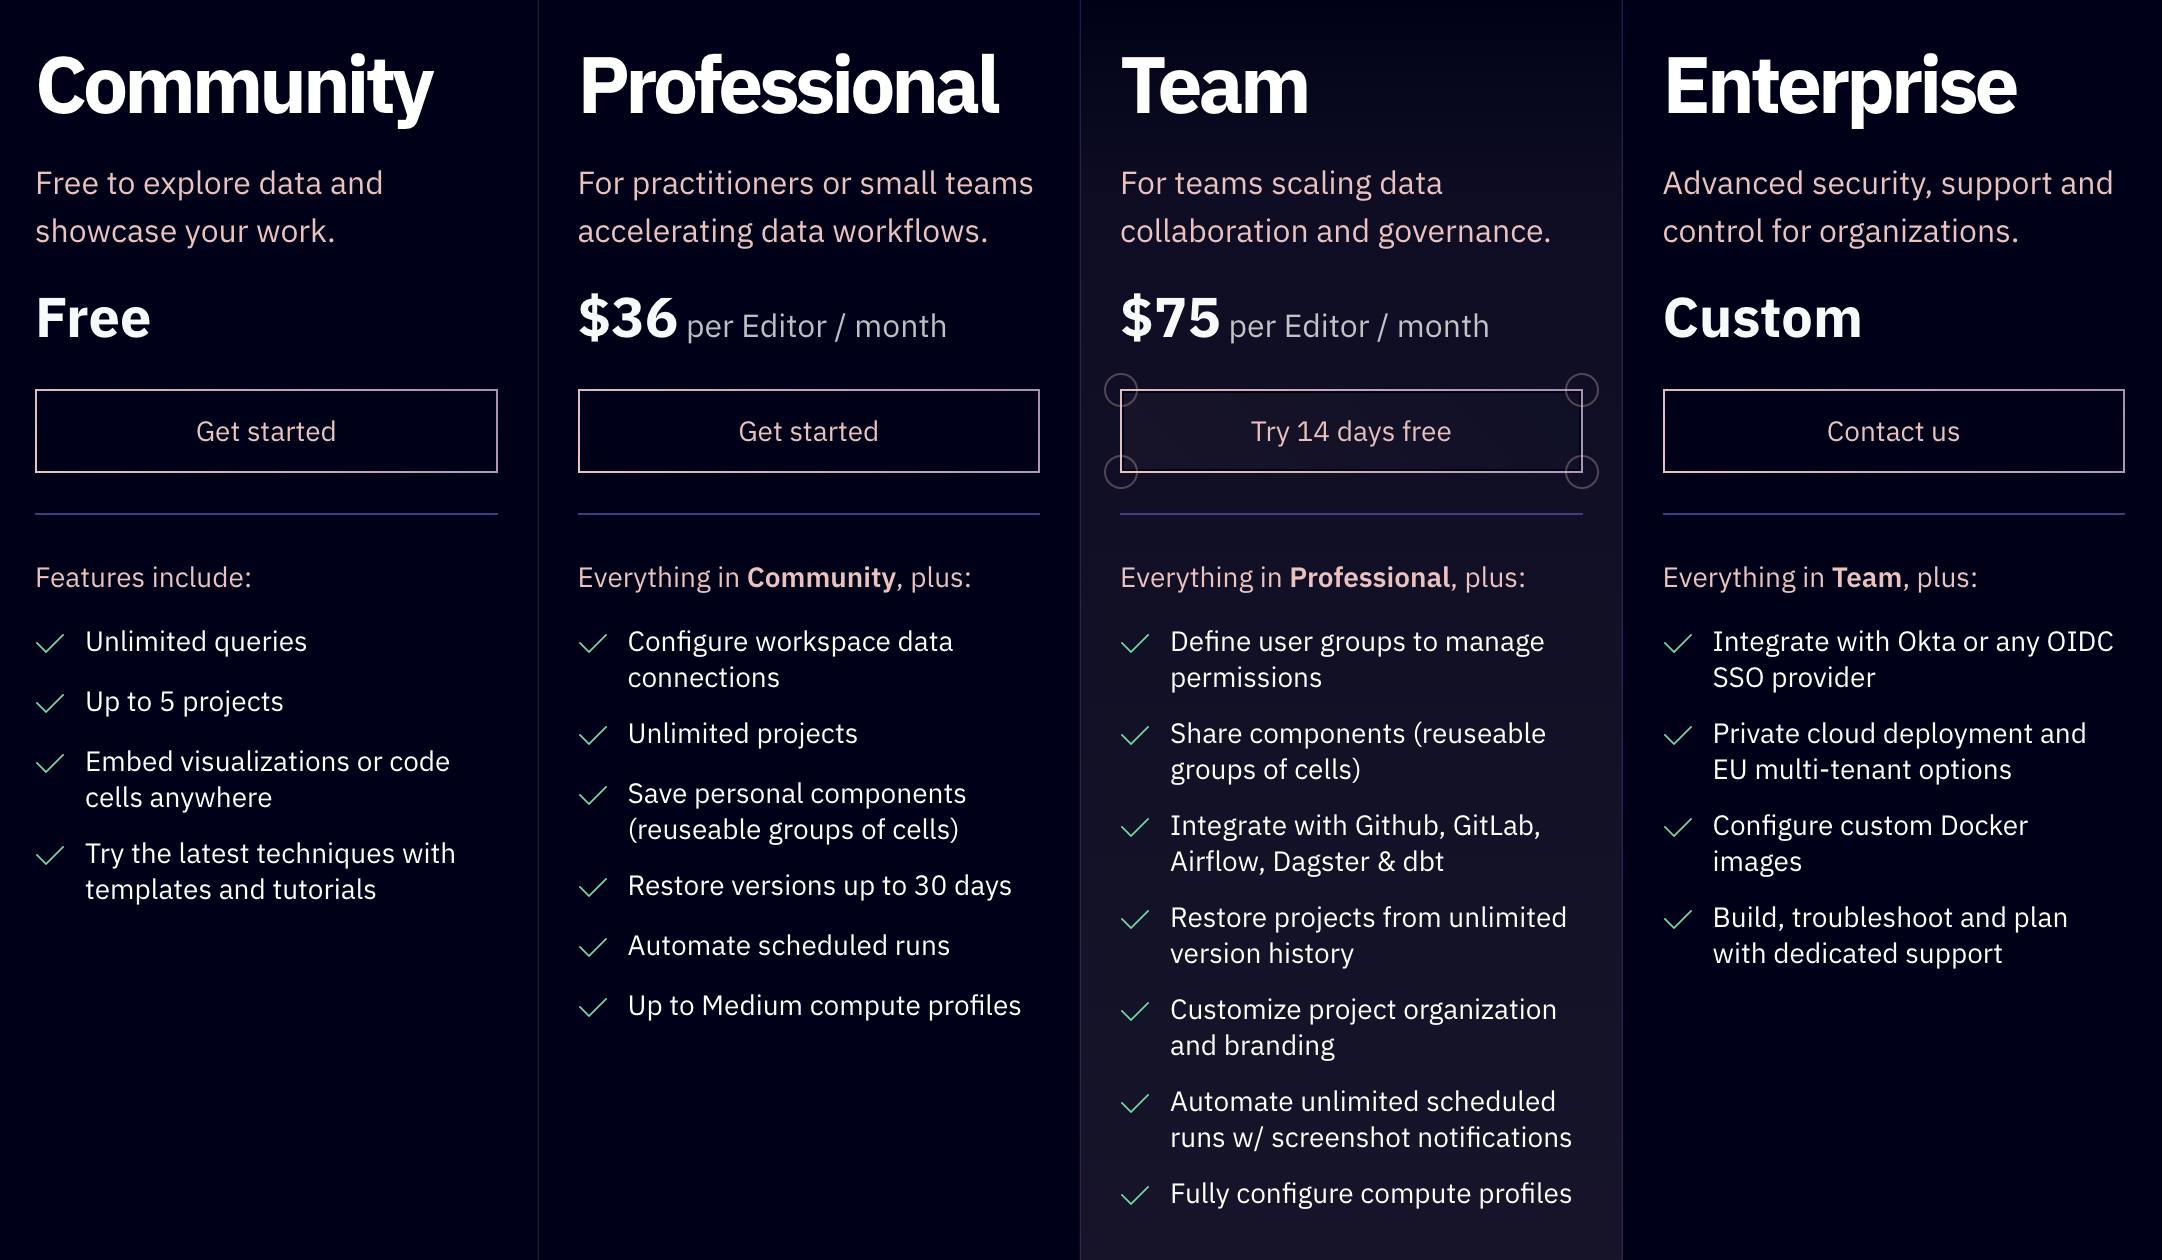
Hex operates on a seat-based subscription pricing model and offers four subscription tiers with flat monthly rates.
Community: Free up to 5 projects. This is best suited for personal use, including data exploration and portfolio showcasing.
Professional: $36 per Editor per month for data practitioners or small teams.
Team: $75 per Editor per month for larger teams scaling data collaboration and governance.
Enterprise: Customized pricing and solutions for larger organizations. Additional benefits include private cloud deployment, custom Docker images, and dedicated troubleshooting and support.
Hex charges per seat on Editors and Admins, but allows Viewers and Guests to use the platform for free on Professional and Team plans. McCardel highlights that non-data users like engineers and product managers have often come in as Viewers and then become Editors over time.
Source: Hex
Hex also offers a 14-day free trial with premium features that users can sign up for with no payment card required. At the end of the trial, Hex will prompt trial users to either continue on a paid plan or be downgraded to the free Community Plan and lose access to premium features.
Traction
As of March 2023, Hex served 500+ companies across B2B and B2C, including Brex, Notion, Toast, Chegg, AngelList, Loom, and Fivetran. In 2022, the company grew both customer count and revenue by 4x and users on the platform by 10x. Hex’s 2023 launch of a new pricing tier (presumably expanding the free tier) also extended access to a larger user base.

Source: Hex
Valuation
In March 2023, Hex raised a $28 million Series B extension at an undisclosed valuation led by Sequoia, with participation from existing investors Andreessen Horowitz, Amplify, and Snowflake. Other existing investors include Redpoint and Databricks. The round was preempted by Sequoia, offering very little dilution while extending Hex’s runway to roughly 5 years. To date, Hex has raised over $100 million.
Key Opportunities
Decreasing Knowledge Gap through AI
Through AI, Hex can increase the number of potential users by lowering the barrier to entry for data users to learn and do data work. New large language models (LLMs), such as GPT-4 have enabled easy generation of SQL and Python code for querying data. Hex Magic is already capable of parsing through and understanding the schemas and project context, allowing Hex to turn questions written in natural language (e.g. “How many users churned?”) into SQL or Python code that can pull the right data to answer the question. AI has the potential to give time back to data teams while empowering non-technical users to ask and answer questions.
In a conversation with Hex CEO McCardel, he told Contrary Research that:
“Data people sometimes think self-serve is evil. But a lot of what you are going to see is this synthesis at the middle ground. Data professionals will recognize their roles should help structure the right questions for non-data people to answer questions from the data.”
For now, Hex Magic primarily serves as an augmentation to querying workflows, but contextualizing business insights could be a natural product extension. Hex’s broader goal is to help users leverage their organization’s prior workflows, prompt their own work, and give them a head start.
Pricing Expansion Beyond Data Users
Retool offers an example of how revenue can grow through extending a technical product to non-technical end users. Retool allows technical users to easily build internal tools and charges per seat, regardless of whether the seat is occupied by a technical user building the internal tool or by a non-technical end user. Thus, Retool is able to monetize across an organization, adding seats from both technical and non-technical users.
Similarly, while in 2023 Viewers and Guests are free on Hex’s Professional and Team plans, Hex could explore a similar revenue growth opportunity in the future. It can extend its usage from more technical data scientists and analysts who are creating dashboards in Hex to non-technical business users who nevertheless find value in being able to access and refresh the Hex dashboard on a regular basis.
Capitalizing on Data Education
Hex’s TAM should increase as data literacy becomes both more in demand and more widespread. A 2022 survey of 1.2K C-level executives and 6K employees found business leaders were predicting that data literacy would be the most in-demand skill by 2030. 78% of employees reported that they were investing their own time and money to learn additional professional skills – amounting to 7 hours each month and nearly $2,800 each year. Meanwhile, the number of potential non-technical users for Hex is steadily increasing. Hex’s docs and blog currently provide insights on this, but the company could further contribute to this trend by formalizing educational resources on data and querying languages. One of its main competitors, Mode, already provides this.
Key Risks
High Switching Costs from Established Data Players
Data is a very competitive market with many legacy players. Hex is still a relatively new player, and its target customers may already have existing data tools embedded in their organizations. If a customer already works with another data tooling player, it could be disincentivized to switch to Hex given migration and switching costs. According to one Hex customer, the cost of migrating all the dashboards and visualizations (sometimes hundreds of charts and associated data tables) that exist in Looker onto Hex would be extremely large. Companies that do not have have established data tools would experience less friction switching over to Hex. For companies with incumbents' data tools engrained, Hex must prove that productivity gains outweigh the migration cost and implementation time.
Ability to Penetrate Enterprises
Software platforms often need to move upmarket to enterprise customers in order to unlock new users and higher ACVs. Hex has established a strong base of primarily small and medium-sized technology companies. However, moving upmarket can be challenging as enterprises require more complexity and sometimes have existing internal solutions. One Hex customer, a well-trained data scientist, noted that Hex did not support functionality that could be achieved in PyCharm. Other companies like Uber developed their own internal data science tools (Data Science Workbench) to manage their massive data workloads. Hex does sell to enterprises today, but it must continue solidifying product features, such as security, on-prem hosting, and sales motion.
Macroeconomic Headwinds
Higher interest rates have caused a pullback in valuations and in spend for technology companies, which make up a large proportion of Hex’s customers. According to one former Hex customer at a unicorn marketplace company, the company churned because adverse macroeconomic conditions caused them to lay off their product analytics teams, the core users of Hex. Data teams, in particular, can be especially vulnerable to layoffs given that practitioners are typically paid highly. Cutting staff on these teams can lead to substantial cost savings. Furthermore, data teams could be seen as less essential to teams responsible for the core operations of a company, like product management or engineering teams.
Summary
Companies are rapidly investing in data teams to analyze, predict, and adapt to changing business needs, but the tools for data scientists are still in the early innings of modernization. What Figma did for designers, and what Notion did for documentation, Hex aims to do for data users as well. Hex achieved early traction by enabling collaboration, connectivity, and productivity for smaller startups as well as mid-staged companies.
Hex intends to help bridge the gap between data teams and non-technical stakeholders. Although Hex operates in a rapidly growing market, the company also faces several risks, including intense competition in a crowded data analytics market and the ability to push upmarket as incumbent or internal tools prove a stronghold. To stay competitive, Hex must continue building its user base by (1) reducing the data knowledge gap for the “analytically technical,” (2) satisfying the technical requirements for more advanced data practitioners, and (3) expanding upon integrations and collaboration functionalities for both parties.