
Thesis
Experimentation is widely used in product management to measure the impact of products and features by testing small changes at scale and using the results to learn, iterate, and optimize. Through experimentation, businesses can gain insights into what customers respond to best, what drives engagement, and what leads to increased conversions or sales. Many of the world’s leading technology companies conduct thousands of such experiments, often referred to as “A/B tests”, annually. The A/B testing software market was valued at $1 billion in 2021 and is expected to reach $3.4 billion by 2032.
While large tech companies can afford to run many experiments using their internal experimentation platforms, smaller companies without the resources to build an in-house experimentation platform may struggle to understand how certain products and features drive their business goals. For many product teams, it is hard to quantify the impact of product iteration on core business metrics like growth, engagement, or retention. Modern tools are needed to make it easy for companies to avoid common pitfalls in product experimentation. With 60% of companies already using A/B testing and an additional 34% of remaining companies planning to use it as of 2023, the demand for product testing software is large and likely to grow.
Statsig is a platform that enables companies to run rapid product experiments and analyze how users respond to new features. It aspires to accelerate product innovation by enabling anyone with an idea, from developers and PMs to designers, to run rapid tests, iterate, measure business impact, and ship features.
Founding Story
Statsig was founded in 2021 by Vijaye Raji (CEO). Raji started his career at Microsoft where he worked on projects including the Windows Application Framework, SQL Server Modeling Language, Microsoft TV, and Visual Studio.
After over nine years at Microsoft, Raji joined Facebook’s Seattle campus, which had only a dozen employees at the time he joined. In his leadership role there, he helped grow the campus to over 5K people. During his 10 years at Facebook, he worked on Messenger, Audience Network, Facebook Marketplace, Facebook Gaming, Facebook Video, and more.
During his time at Facebook, Vijaye learned how Facebook used internal development tools to streamline how new features were tested and implemented. Among these tools were Gatekeeper, which lets developers build features visible to only a targeted set of users, and Deltoid, a visual map of how critical metrics are affected by new features inspired Statsig.
During a 2022 interview with Microsoft, Raji stated that:
“The idea to go build product-building or experimentation tools came while I was at Facebook. I was meeting people who were starting companies and having to rely on tools that were far behind what we took for granted at Facebook. I felt that this was an opportunity to add value to a huge variety of companies by making such tools available to all.”
Product
Feature Management
Feature Gates
Feature gates, or feature flags, are used as switches to turn specific system behavior on or off in production. Teams often use these gates to activate certain features or behavior for a small percentage of their user base. This approach helps to gradually introduce a software release to limit the impact of any unanticipated system behavior or to enable restricted behavior only for specific users.
Statsig offers several built-in capabilities with feature gates. A feature gate can function as a simple kill switch, allowing customers to turn off a particular code branch for all users. Additionally, customers can create user targeting rules based on Statsig-derived environment attributes, such as location, client device, browser type, and client app version. Alternatively, user targeting rules can be created based on user attributes, such as email and user ID that a user provides. Lastly, each feature gate offers built-in A/B testing, allowing customers to automatically compare their feature's performance in production with the default or control option.
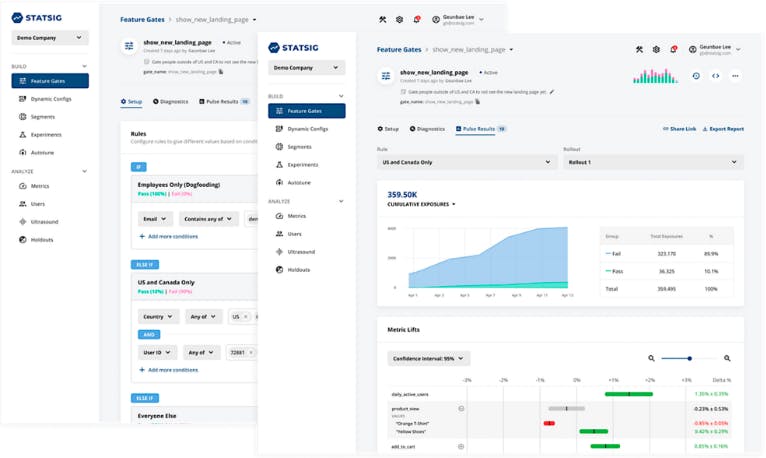
Source: Statsig
Dynamic Config
Dynamic config allows developers to replace hardcoded values in their applications with configuration parameters that can be changed at any time. With dynamic config, developers can include any property across their client-side and server-side application code, from button colors to ranking configurations, in their dynamic configuration. This capability allows them to control the behavior of their application dynamically in near real-time, making optimizing their products for their users' needs easier.
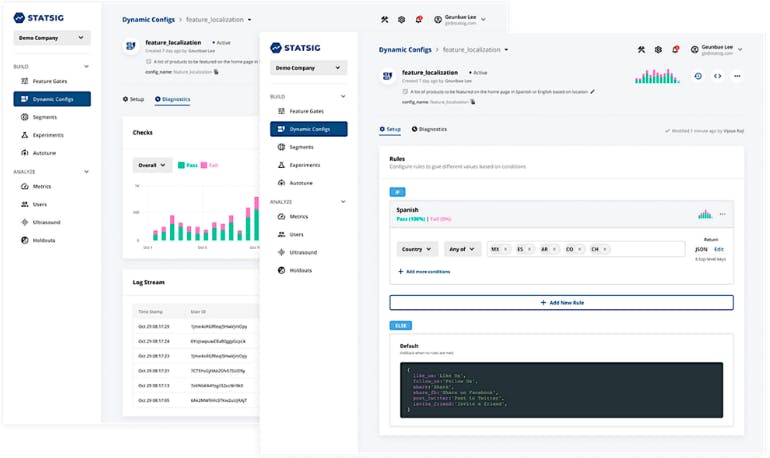
Source: Statsig
Experimentation
Experiments
Experiments allow developers to run randomized controlled experiments to evaluate their software products and features. As with A/B tests, Experiments provide a range of features that make it easy to set up and analyze experiments. For example, Experiments automatically compute the sample size required to achieve statistical significance for a given experiment, streamlining the experiment design process.
Experiments also allow developers to configure allocations to define the proportion of eligible users exposed to each variant in the experiment. In addition, they enable developers to review the Metric Lifts and confidence intervals for all of their business metrics and choose intervals ranging from 80% to 99%, depending on the confidence level required for their decision.
Developers can also analyze Metric Lifts for different segments by filtering for dimensions such as operating system and browser version, making it easier to gain insights into how different segments of users respond to product changes.
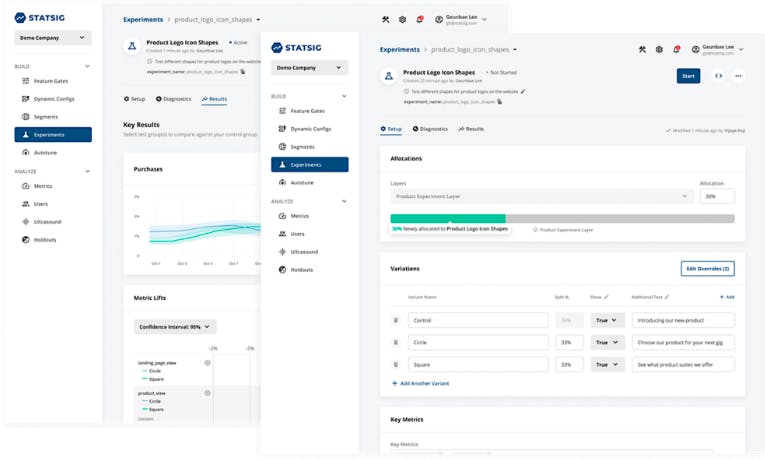
Source: Statsig
Autotune
Autotune, Statsig's Bayesian multi-armed bandit tool, is designed to test and measure different variations of a product or feature and their impact on a target metric. This tool continuously adjusts traffic towards the best-performing variations until it can confidently pick the best variation, which then receives 100% of the traffic. To do this, Autotune uses a Bayesian Thompson sampling algorithm to estimate the probability of each variant being the best and allocate a proportional amount of traffic accordingly.
The multi-armed bandit algorithm underlying Autotune works by adding more users to treatment as soon as it recognizes that it is better at maximizing the reward (the target metric). Throughout the process, higher-performing treatments are allocated more traffic, while underperforming treatments are allocated less traffic. The process terminates when the winning treatment beats the second-best treatment by a sufficient margin.
Compared to A/B testing, Autotune has two key differences. First, the traffic split is not fixed throughout the test. Instead, Autotune diverts more traffic to the winner and less traffic from the losers to minimize mistakes. However, this means the user experience may not be consistent upon repeated visits. Second, Autotune can only optimize for a single metric and is not an effective way to understand the secondary effects of changes or measure a collection of metrics.
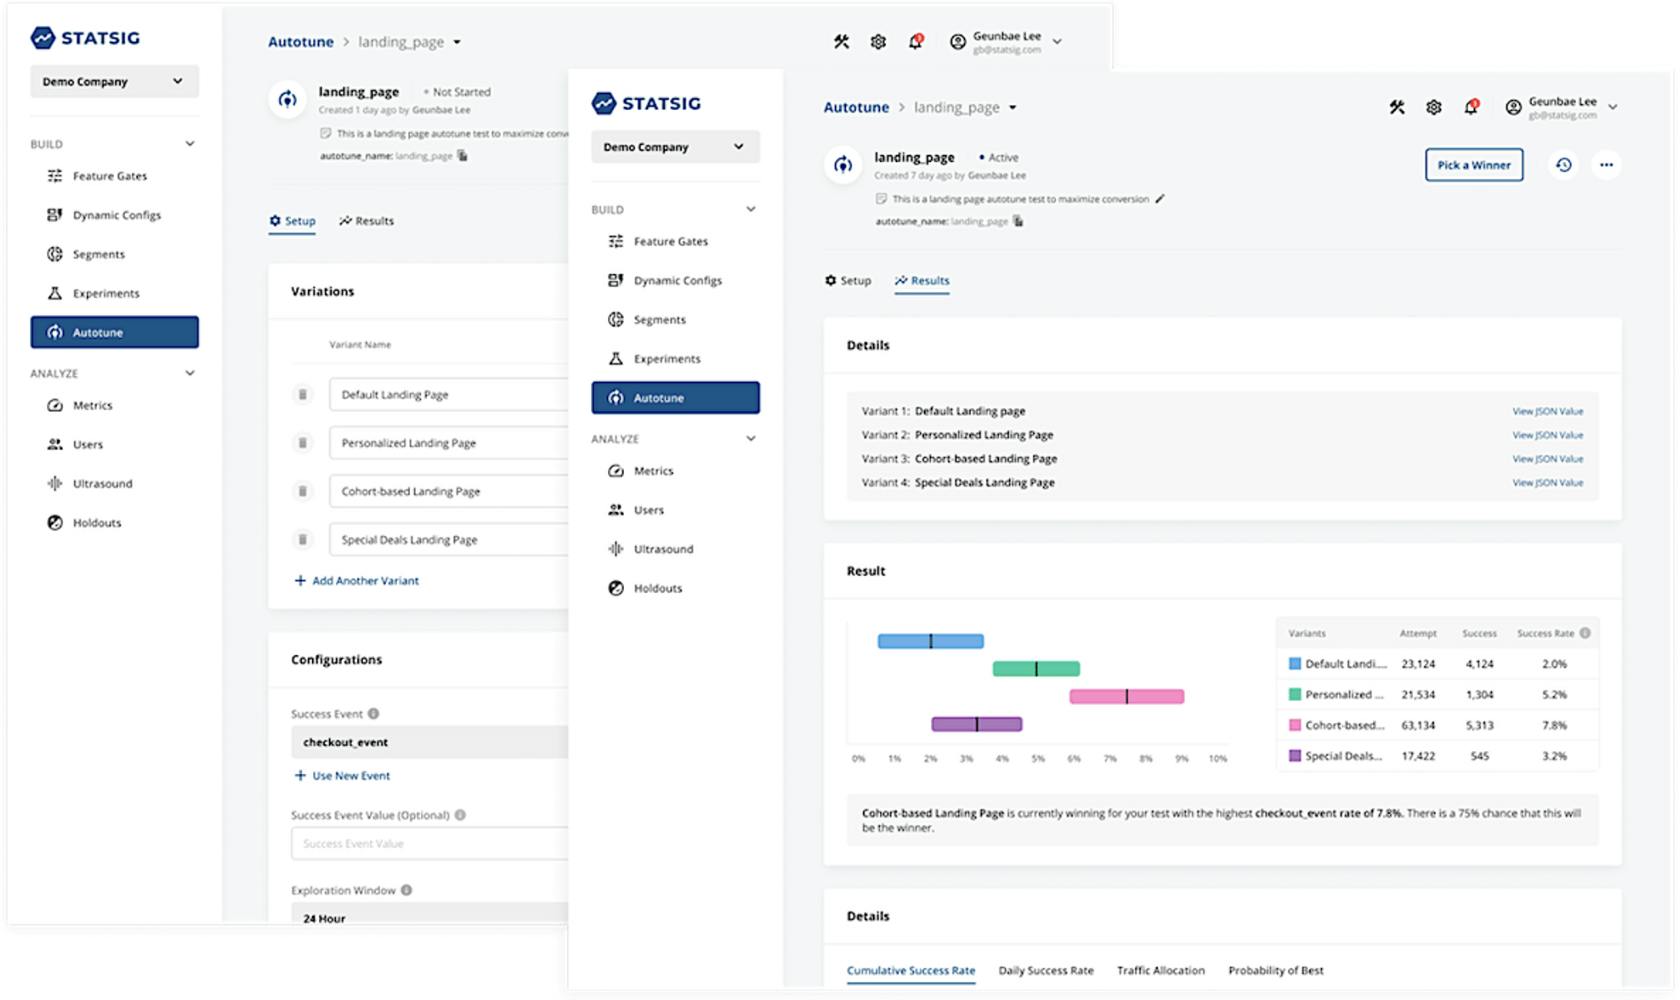
Source: Statsig
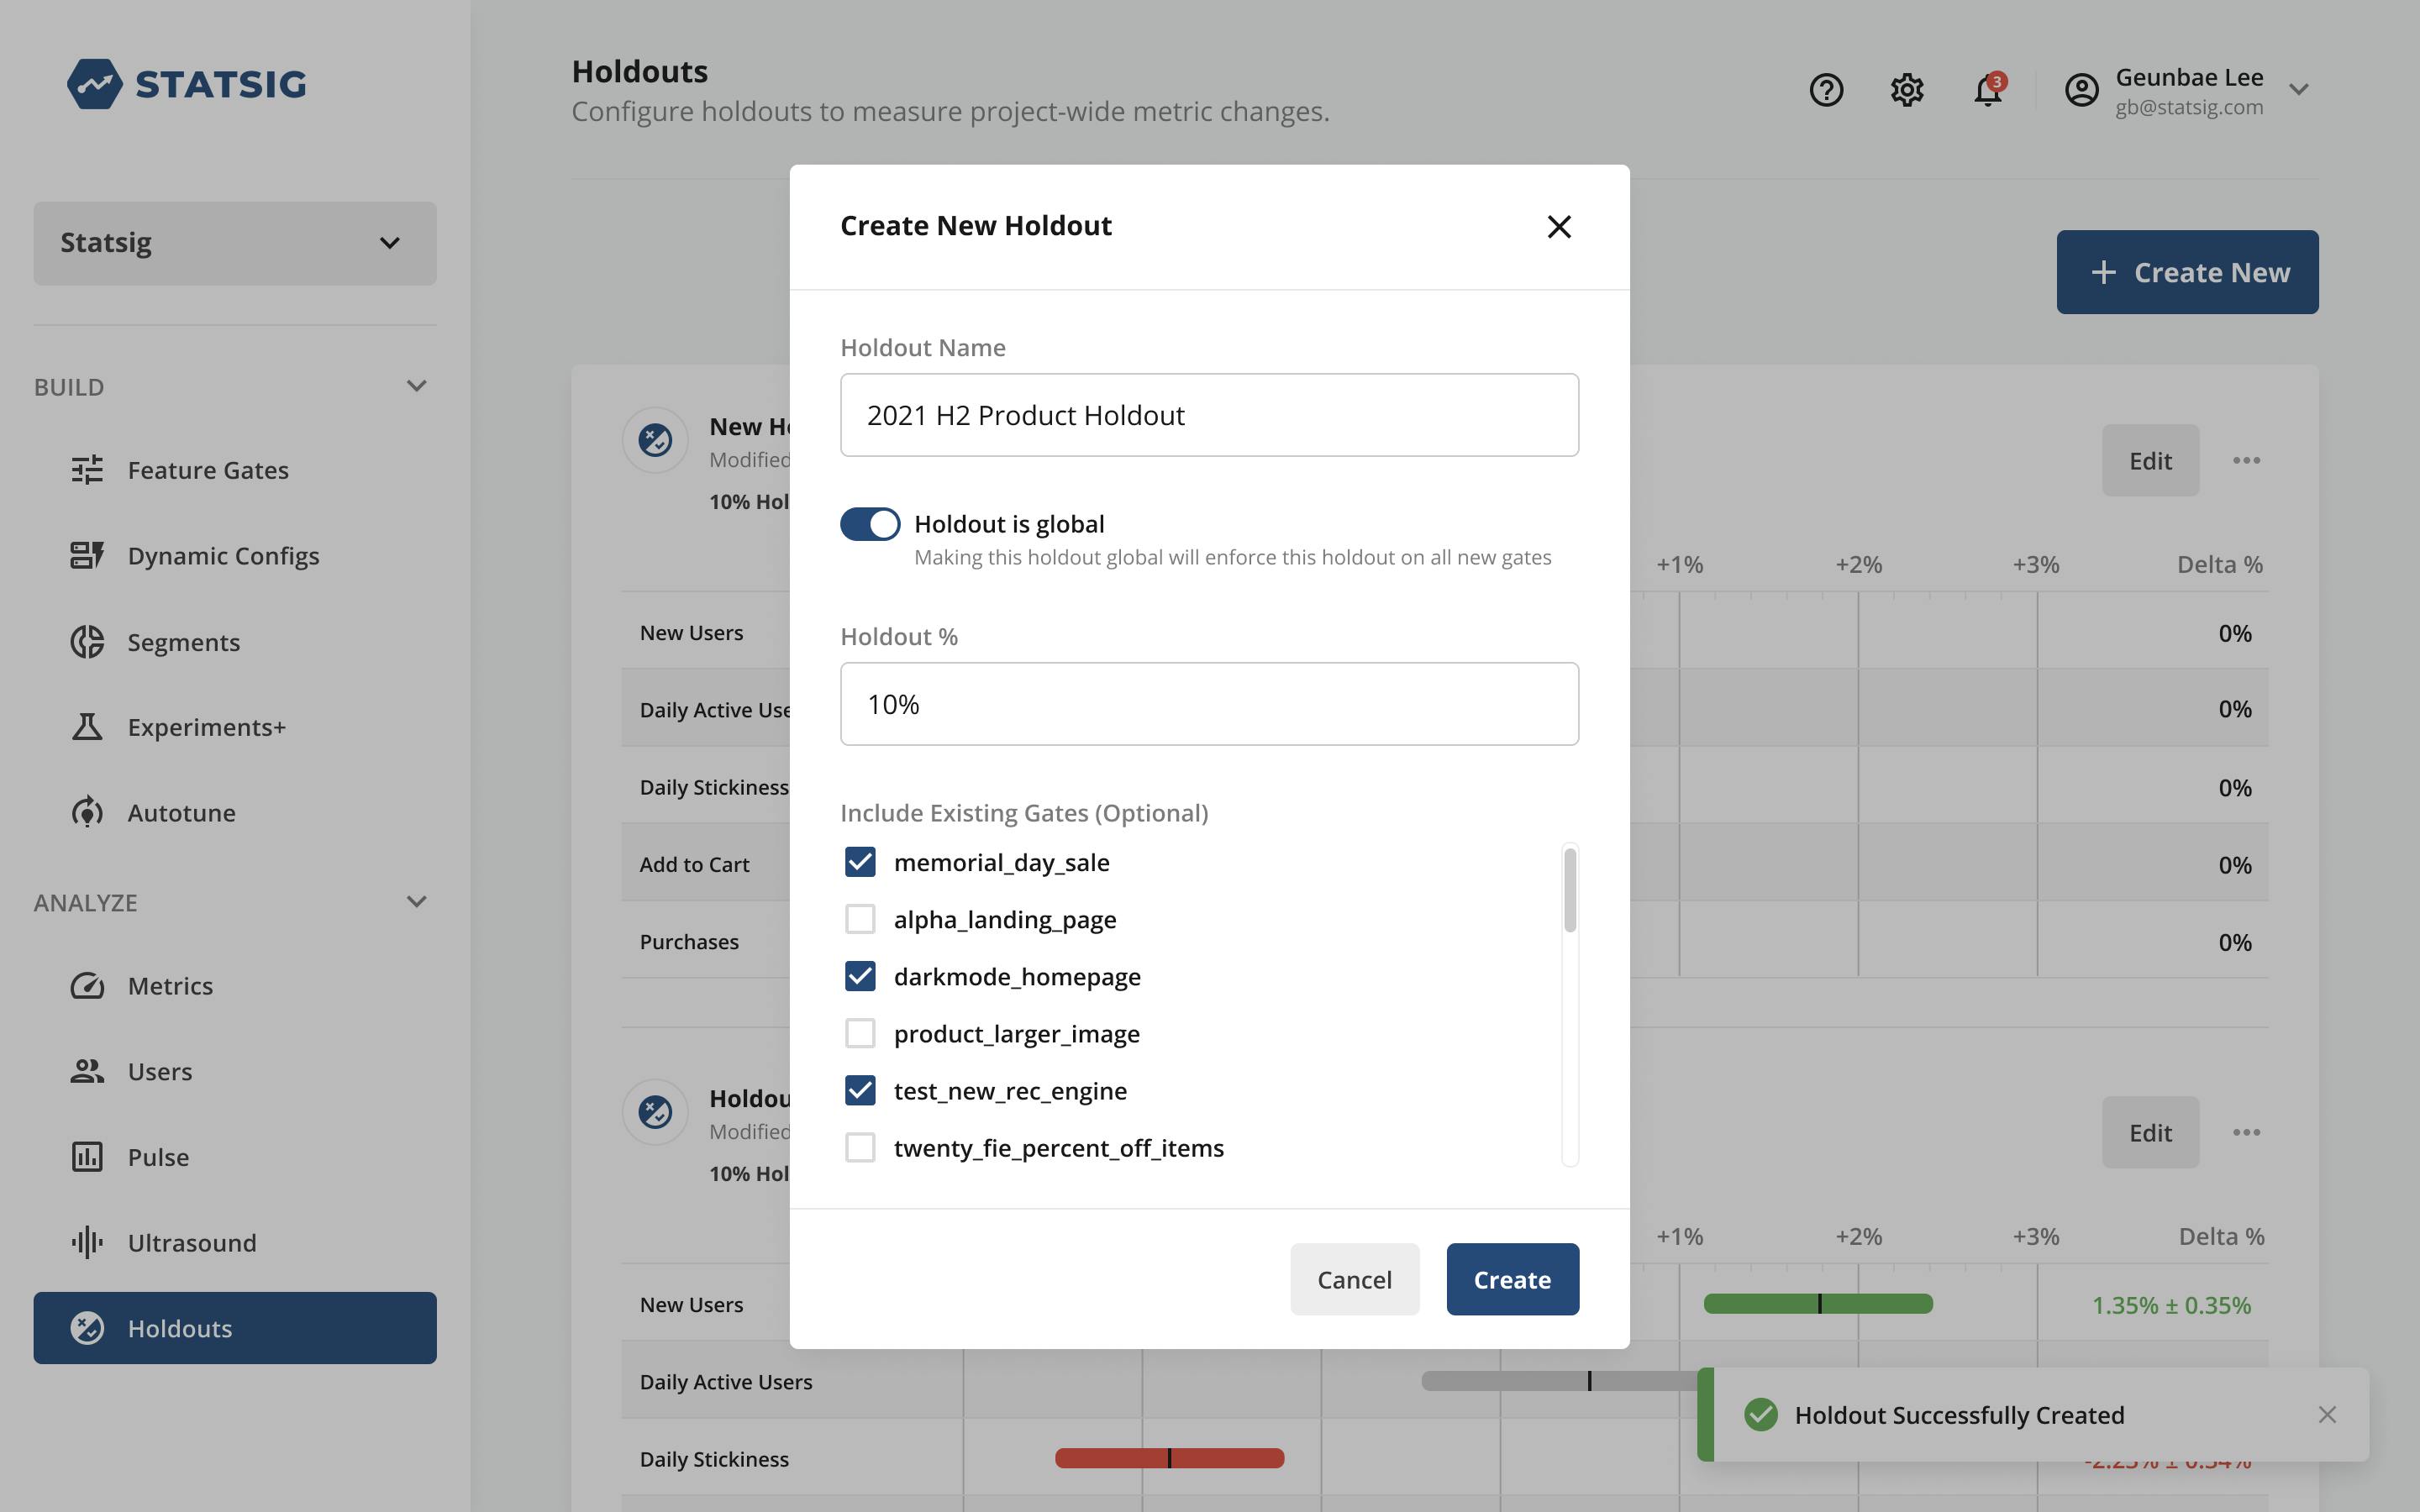
Holdout
Holdouts measure the aggregate impact of multiple features on user behavior. A “Holdout” is a group of users intentionally held back from a set of features to measure the overall impact of the feature set. This approach differs from A/B tests or experiments comparing control and test groups for a single feature. By comparing a “global” control group with users exposed to a subset of the features, holdouts provide insights into how different features interact and impact user behavior.
Source: Statsig
Insights
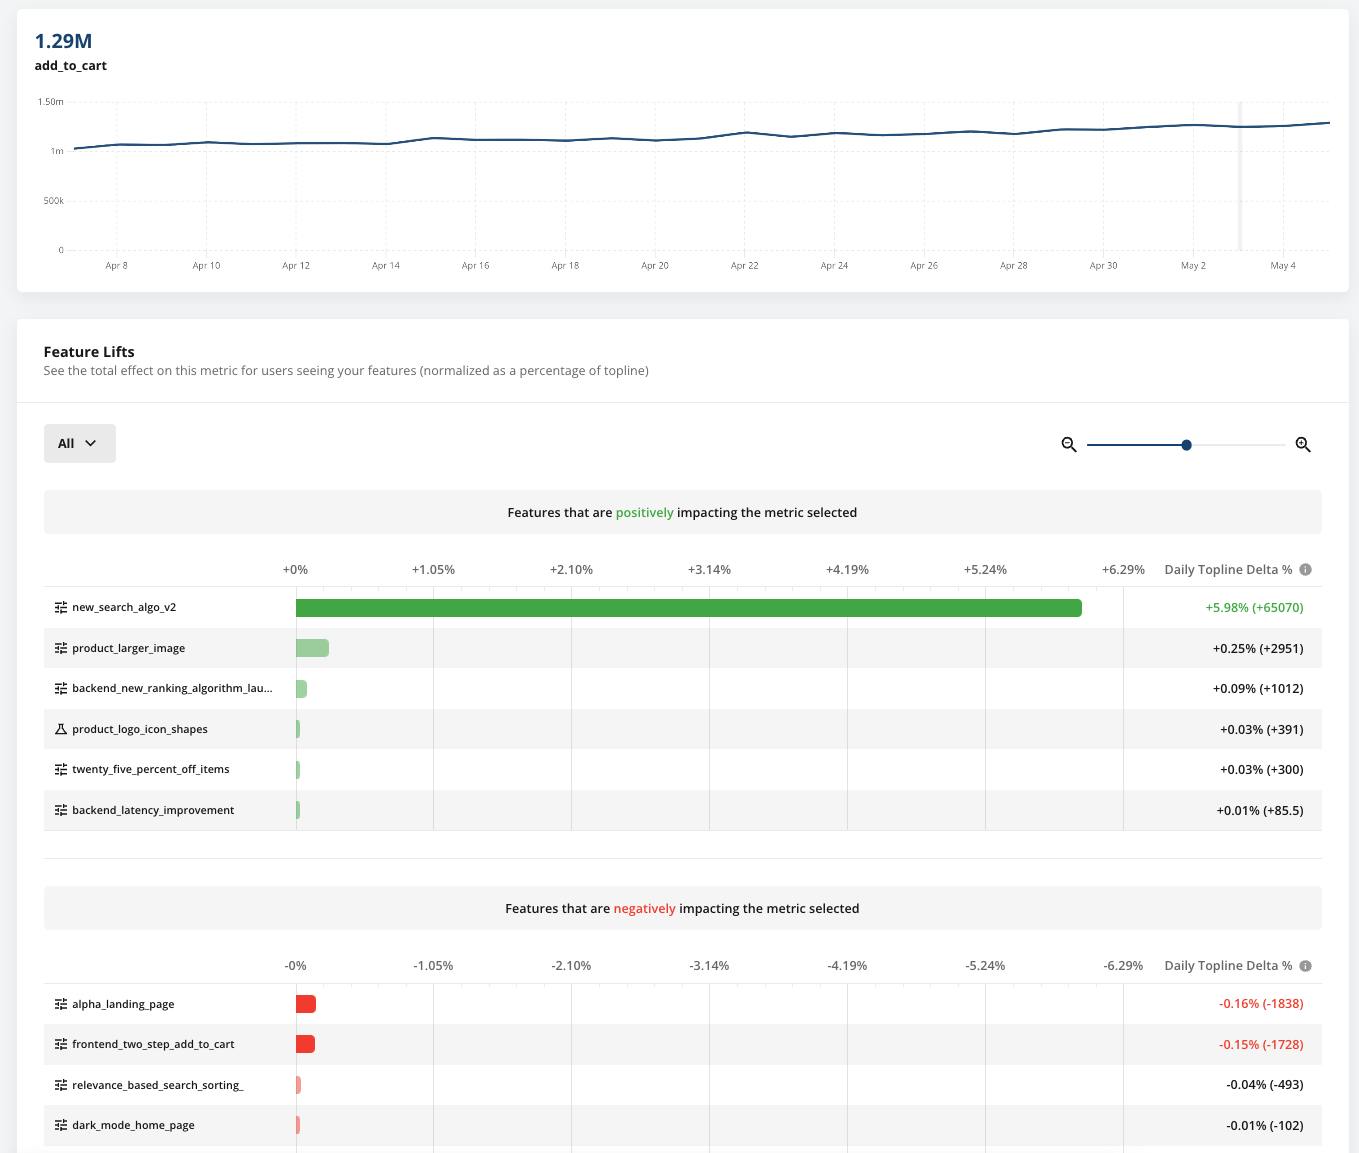
Insights enable developers to identify the impact of active experiments and feature gates on a specific metric of interest. With Insights, customers can identify the root causes of unexpected changes in a metric.
Source: Statsig
Data Warehouse
Data Warehouse Ingestion
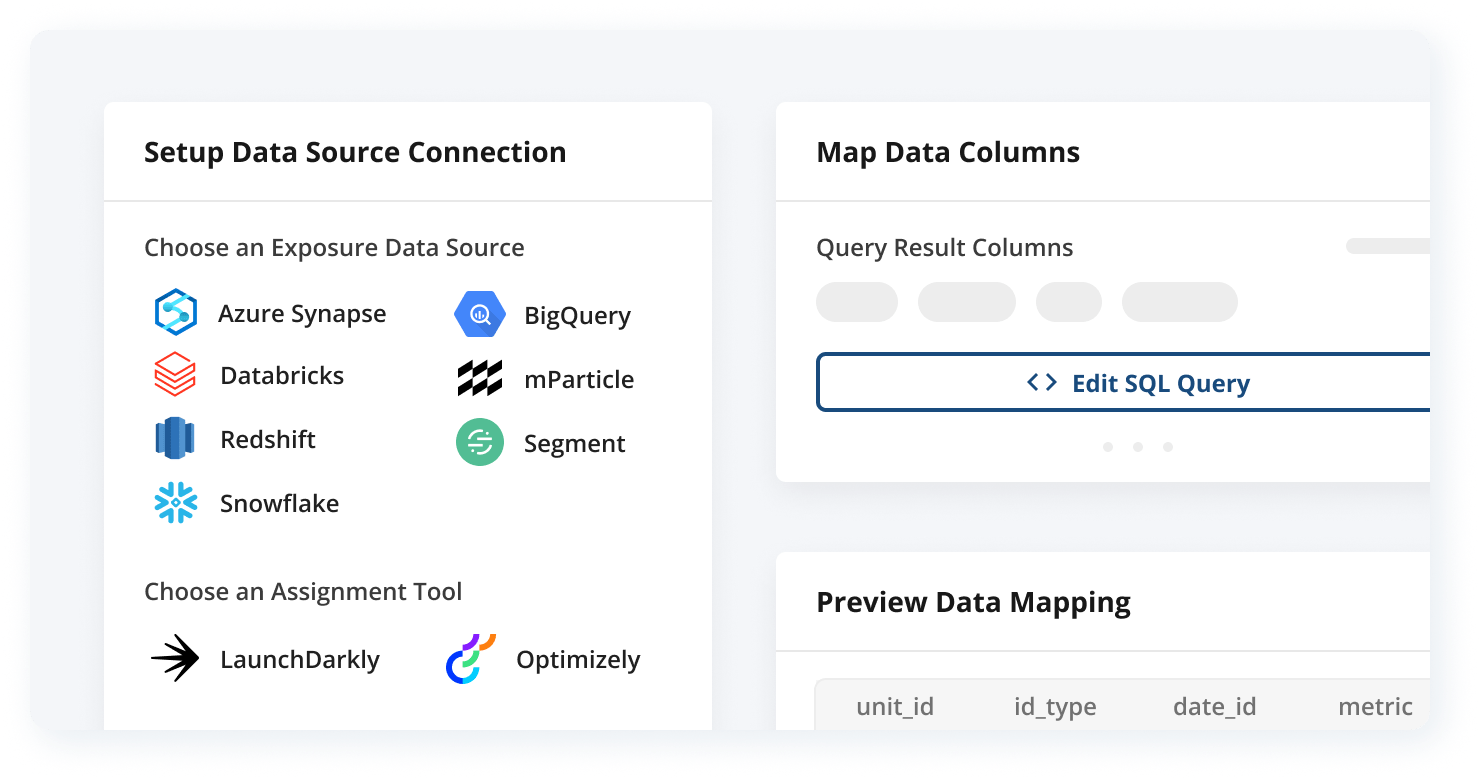
Data Warehouse Ingestion allows developers to send both raw events and pre-computed metrics from their data warehouse directly to Statsig for analysis. Statsig supports ingestion from various providers, including BigQuery, Redshift, Snowflake, Databricks, Synapse, and S3. Ingestion is set up on a daily schedule. Statsig will run a query provided by the customer on their data warehouse, download the result set, and materialize the results into their console, the same as those that came in through the SDK. In the event of late-arriving or updated data, Statsig automatically detects changes on a rolling window by listening for row count changes and reloads the data for the corresponding day, ensuring that the most up-to-date information is available for analysis.
Source: Statsig
Metrics
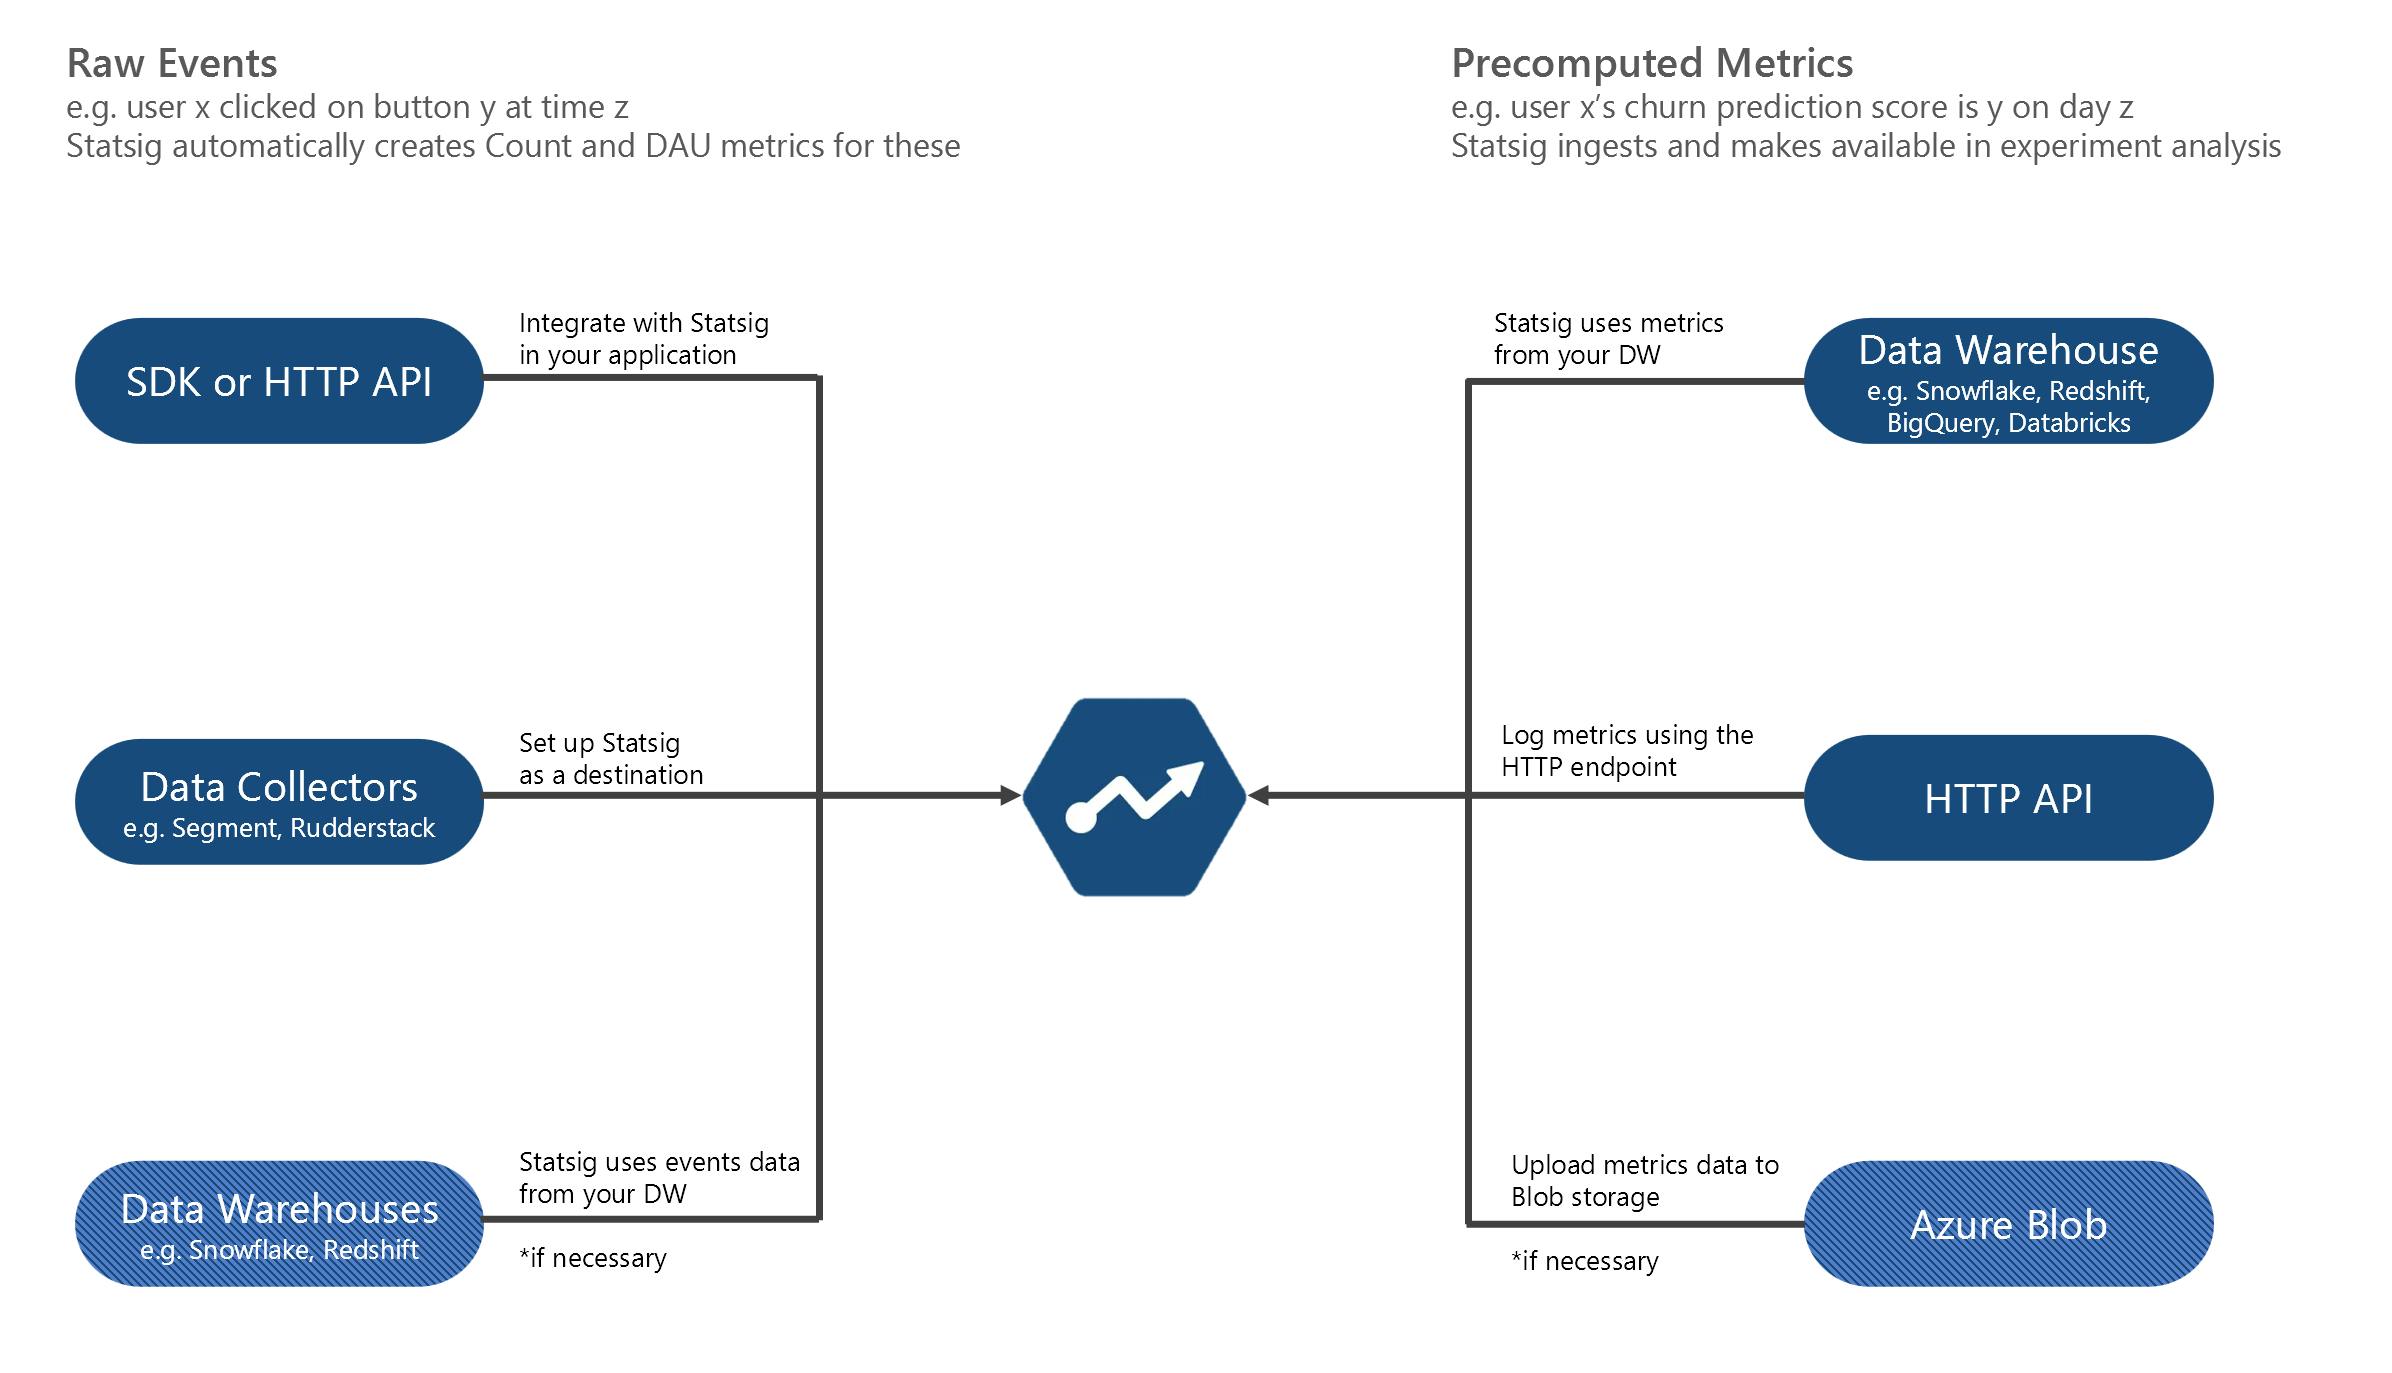
Metrics offer customers a comprehensive view of their product metrics by combining data from existing sources. With Statsig’s metrics offering, customers can track the impact of new features and experiments on metrics. Statsig automatically creates metrics from the raw events that customers log from their applications and raw and transformed events that customers send to Statsig via a data collector. This approach streamlines the metric creation process, enabling customers to focus on data analysis rather than manually creating metrics.
In addition, Statsig can also reuse existing precomputed metrics by natively integrating and pulling data from customers’ cloud data warehouses. Lastly, customers can also choose to ingest metrics into Statsig using an HTTP endpoint or Azure Blob storage, giving customers the flexibility to use Statsig with various data sources.
Source: Statsig
Market
Customer
Statsig is a feature management and experimentation platform that enables customers to assess the impact of new functionality and make data-driven decisions at scale. Its customers are product teams seeking more visibility for their products and features. Notable customers include Honeybook, Microsoft, Flipkart, Lime, and WhatNot.
Market Size
The A/B testing software market was estimated at $1 billion in 2021 and is anticipated to grow at a CAGR of 11.6% from 2022-2032 to reach a size of $3.4 billion in 2032. Powering the growth in the experimentation market are factors such as the growth in the number of companies looking to leverage experimentation, and the increase in the average number of experiments performed per company. For example, large tech companies have been increasing the number of experiments they perform. For instance, Google increased the number of experiments it performed from 7K experiments annually in 2016 to over 10K annually in 2017.
Competition
LaunchDarkly: LaunchDarkly is a feature management platform that allows teams to deliver and control software releases through feature flags. It was founded in 2014 and has raised $330.3 million from investors such as Bessemer Ventures, Redpoint Ventures, Insight Partners, and Threshold. It was valued at $3 billion in its Series D round in 2021. While Statsig implements a usage-based pricing model, LaunchDarkly employs a seat-based pricing model, charging its customers a minimum of $8.33 per seat. As of August 2021, it had over 2K customers, including 22 Fortune 100 companies.
Optimizely: Optimizely is a digital experience platform designed to help teams manage and enhance their digital activity and customer experience across all touchpoints. The platform offers a variety of tools, including A/B testing, multivariate testing, website personalization, feature toggle capabilities, web content management, and digital commerce functionalities. Optimizely was founded in 2009. The company raised a total of $251 million from investors, including Andreessen Horowitz, Battery Ventures, and Bain Capital Ventures, before content management company Episerver acquired it in September 2020. It had more than 1K customers at the time. Unlike Statsig’s focus on product experimentation, Optimizely has also developed offerings for content management, commerce, and other areas. However, its wider product suite has also resulted in a more complex pricing plan for which customers must request pricing details for each offer.
Split.io: Split.io is a feature management and experimentation platform that allows users to manage feature flags and perform experiments on their website or application. It was founded in 2015 and has raised $110 million from investors such as Accel, LightSpeed Venture Partners, and M12 - Microsoft’s Venture Fund. Unlike Statsig’s usage-based model, Split.io employs a seat-based pricing model, which charges customers at least $33 per seat beyond its free plan. Companies across financial services, healthcare, media, and retail use it.
Business Model
Statsig differentiates itself from its competitors, many of which employ a seat-based and usage-based pricing system, with its pricing system.
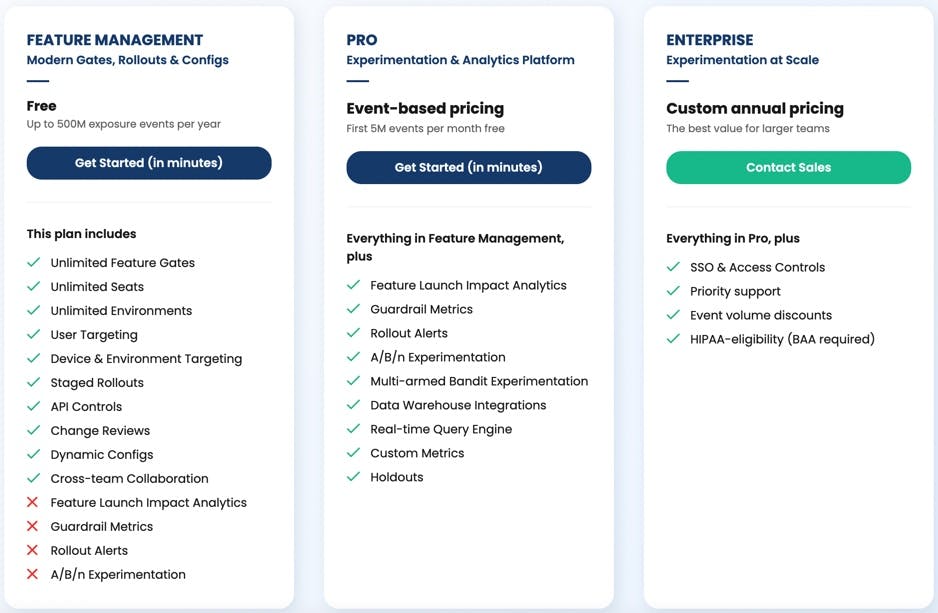
Source: Statsig
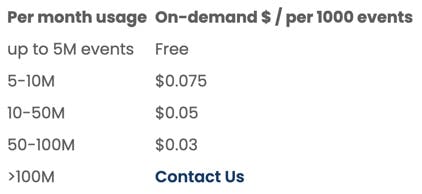
Statsig offers three pricing tiers: Feature Management, Pro, and Enterprise. Feature Management represents Statsig’s free plan and offers customers up to 500 million free exposure events annually, intended to make it easy for developers to try the product. The Pro plan employs event-based pricing and charges customers between $0.03 to $0.075 per 1K events beyond the first 5 million monthly events. The Enterprise plan employs custom annual pricing.
Source: Statsig
In addition to its main pricing tiers, Statsig offers a startup program to encourage startup adoption, providing customers that fulfill its criteria with 25 million monthly events and support.
Traction
Statsig was founded in February 2021 and signed its first enterprise contract in November 2021. Statsig crossed the $1 million annual revenue run rate in Q2 2022. Barely more than a year after its founding, as of May 2022, Statsig had over 300 customers including Microsoft, OpenAI, Figma, Flipkart, Notion, Brex, Eventbrite, Headspace, and OpenSea.
Valuation
In April 2022, Statsig announced $43 million in Series B funding led by Sequoia Capital with participation from Madrona Venture Group at a $420 million valuation.
Key Opportunities
Growing Demand for Experimentation
Studies have shown that companies prioritizing data-driven insights are 23 times more likely to attract new customers, 19 times more likely to be profitable, and can experience growth rates 7 times faster than GDP growth. As companies increasingly leverage product experimentation, they can generate greater insights into user behavior and preferences.
An area of experimentation that companies have been moving towards is A/B testing. With 60% of companies already using it and another 34% planning to use it, A/B testing is the number one method marketers use to optimize conversion rates in 2023. The A/B Testing Software market was estimated at $1 billion in 2021 and is anticipated to grow at a CAGR of 11.6% from 2022-2032, and is expected to reach $3.4 billion in 2032.
Increasing Need for Cost Optimization
In the face of a potential economic downturn, companies are not only slowing capital spending but are also cutting expenses across the board. 60% of B2B marketers say they face reduced or stagnant budgets for 2023. As businesses increasingly look to optimize costs to navigate economic headwinds, they will seek further to leverage product experimentation as a cost optimization lever to test small changes before investing resources at scale. One product leader from a fintech unicorn said that Statsig helped the company better measure the ROI on different initiatives and prevented it from wasting engineering and product resources on initiatives that will not deliver value, stating that:
“That is very easy to justify to $250,000-ish level of spend, which is less than my one engineer salary of a year to be able to pay for a platform like this.”
Key Risks
Stricter Privacy Controls
With stricter privacy controls from Apple (App Tracking Transparency, Privacy Labels, Intelligent Tracking Prevention) and Google (New Play Store Policies), experimentation platforms may find their ability to perform user targeting and data collection hindered. For instance, Apple’s app tracking transparency framework requires app developers to ask users for explicit consent before tracking their activities, reducing app developers' default data access to identify users. While the privacy control measures may impact experimentation dealing with web traffic and anonymized users, experimentation targeted at logged-in users and subscribers should be less impacted.
Competition Against Custom Analytics
Before the emergence of experimentation platforms such as Statsig, one way for companies to perform experiments was to consolidate their data into data lakes or warehouses such as Snowflake and develop their analytic capabilities. With the introduction of Statsig, customers are now duplicating the data they have stored in data warehouses to Statsig to perform experiments. Industry insiders foresee a possibility where companies may have to decide whether they continue to take two copies of the data and have different teams working against different data sources. In such a scenario, experimentation platforms face the risk that some companies may decide to focus on developing their own custom analytics through their data lakes or warehouses.
Summary
Experimentation is a crucial aspect of product management that enables leading tech companies such as Microsoft and Facebook to test small changes at scale, learn, iterate, and optimize. However, smaller companies may lack the resources to build their own experimentation platforms and struggle to quantify product iterations' impact on their business metrics. Statsig was developed to democratize experimentation by enabling companies of all sizes to run rapid targeted experiments and make data-driven decisions at scale. Its feature management and experimentation platform allows product teams to gain more visibility into their products and features.