
Thesis
Nearly every business today is under pressure to be data-driven, especially as software products generate vast streams of user behavior data. The global market for product analytics, or tools that help companies understand how users engage with their digital products, is growing as a result. One analysis valued this market at $7.9 billion in 2023, projecting expansion to about $27 billion by 2032, around 14.6% annual growth.
This growth is fueled by factors such as the rise of mobile apps and ecommerce, widespread digital transformation initiatives, and a competitive imperative for companies to improve user experiences with data-informed decisions. As more services move online and competition intensifies, organizations increasingly need sophisticated analytics to track user journeys, boost conversions, and retain customers. Understanding product signals is also critical to the success of new sales strategies like “Product-Led Growth” (PLG). These signals provide valuable insights into user behavior. Identifying and acting on product signals allows companies to tailor their product experiences to user needs, ensuring that every touchpoint nudges users closer to becoming paying customers.
Mixpanel is a product analytics platform that helps businesses track and analyze user interactions within their web and mobile applications by capturing event-based data such as clicks, form submissions, and sign-ups. Mixpanel was an early entrant to the product analytics market, and its product enables product, growth, and engineering teams to answer engagement and retention questions more easily without needing to write queries. Its mission, as laid out by CEO Amir Movafaghi in April 2023, is to “bring the power of event analytics to everyone.”
Founding Story
Mixpanel was founded in 2009 by Suhail Doshi (former CEO) and Tim Trefren.
Both Doshi and Trefren were students at Arizona State University, where they met as classmates in a discrete math class. Doshi studied Computer Systems Engineering, and Trefren studied Computer Science. After class one day, Doshi decided to introduce himself to a couple of Computer Science students and pitch the idea of doing a startup together. All of the students seemed interested, but Trefren was the only one who followed up. After Trefren got back from a study abroad semester in Singapore, Doshi pitched the idea of Mixpanel to him. Trefren was interested, and they decided to do the startup together. They both decided to drop out of university after being accepted into Y Combinator's S09 batch.
The inspiration for Mixpanel originated during Doshi's internship at Slide, a company led by PayPal co-founder Max Levchin. Doshi observed that product teams lacked effective tools to measure the success of their digital products. The company had spent $1 million on building its own customized internal analytics software. Doshi reasoned that if multiple companies were independently building similar tools, there was a clear demand for a centralized analytics platform that could serve various clients, allowing these companies to focus on their core products.
Traditional web analytics platforms, such as Google Analytics, primarily tracked page views, which were insufficient for understanding user behavior in dynamic web and mobile applications. Doshi and Trefren envisioned an analytics solution that focused on event-based tracking, monitoring specific user actions like clicks and scrolls to provide more meaningful insights. This approach would enable businesses to gain a deeper understanding of user engagement and retention.
Doshi led the company as CEO from 2009 to 2018. In April 2018, he stepped down and became Chairman, promoting Amir Movafaghi, a former Twitter executive who had joined as COO in 2017, to CEO. Tenfren left the company in August 2019 and co-founded Recheck in September 2023, a “verification platform for residential solar salespeople and installers”.
Mixpanel has made other executive hires since the departure of its cofounders. Amy Hsuan joined in October 2019 as Senior Vice President of Global Customer Experience and became Chief Customer & Revenue Officer in February 2025. Hsuan previously spent over seven years at BCG. Edward Hsu joined in February 2025 as Chief Product Officer, having previously worked in product roles at Rescale and D2iQ.
Product
Source: Mixpanel
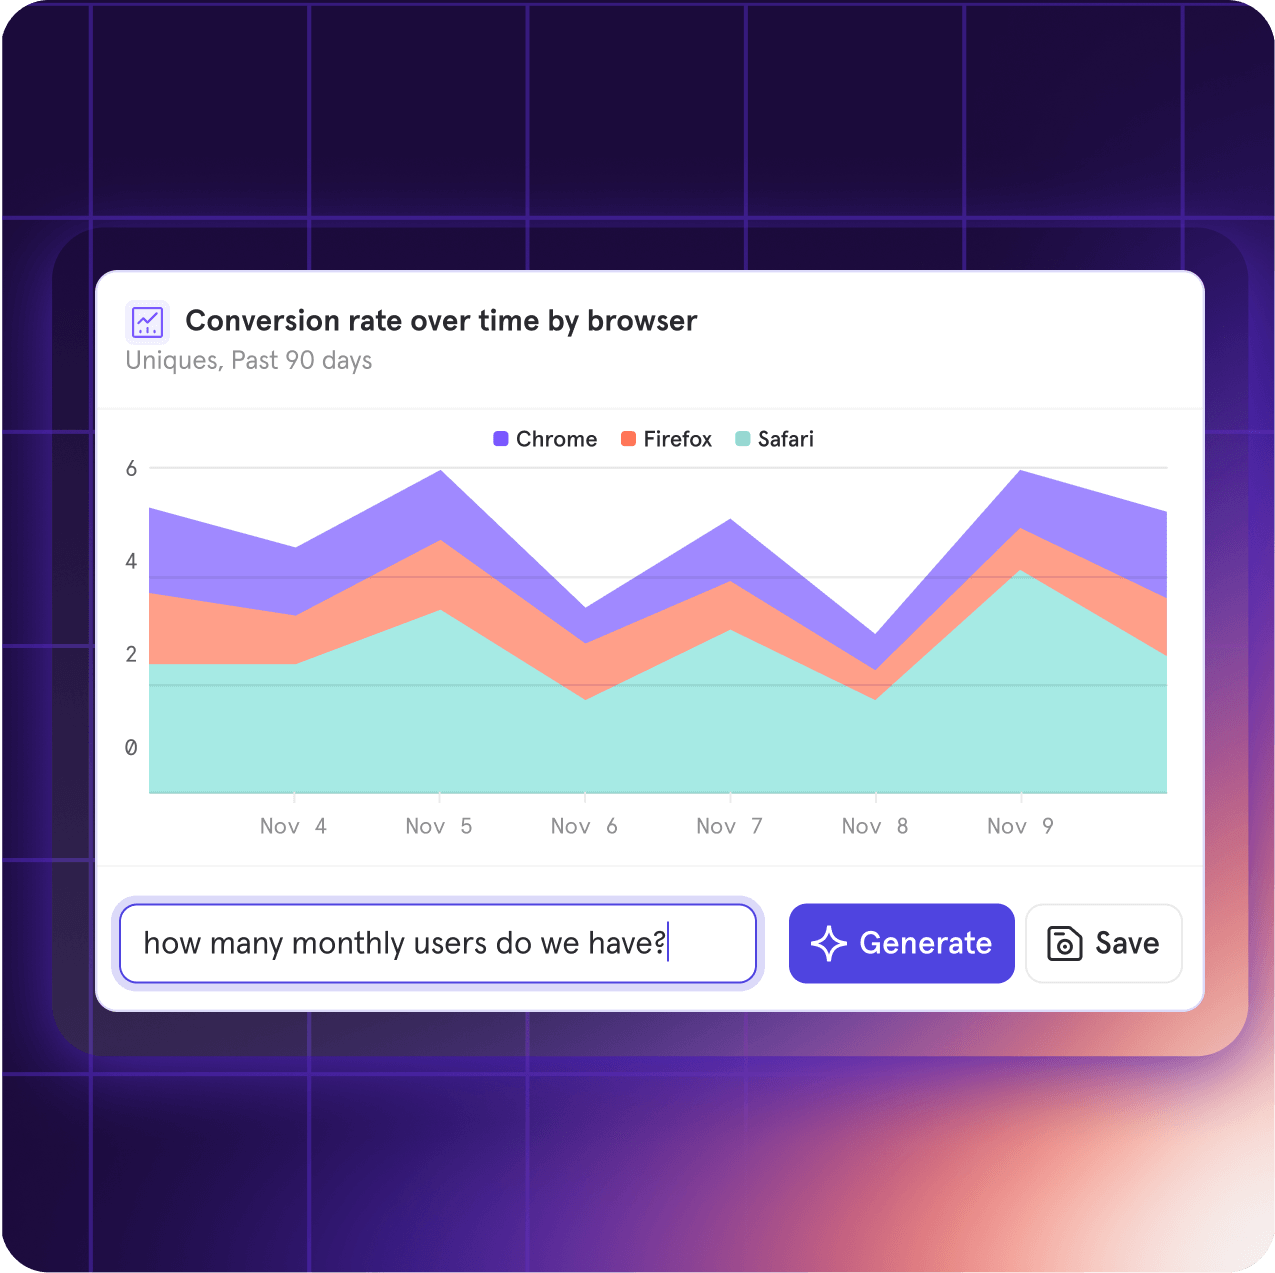
Mixpanel is a product analytics platform that enables companies to understand how users interact with their digital products. The platform is structured around three core elements: Events, Users, and Properties. By tracking user actions, known as events, Mixpanel provides insights into user engagement, retention, and overall product usage. This data-driven approach assists product teams in making well-informed decisions.
The platform is designed for speed and scalability. Its architecture supports near real-time data processing so that teams can make decisions based on the most current user behavior data available. The platform can deliver funnel analyses up to seven times faster than traditional data warehouses in Mixpanel’s benchmarking. Mixpanel’s infrastructure is built to handle trillions of events, all while maintaining strong security and compliance standards.
Events
Events are specific actions taken by users within a product, such as clicks, form submissions, or purchases. Each event is logged with a name, a timestamp, and a unique identifier (Distinct ID) that links it to the user who performed the action.
Users
Users are the individuals interacting with a product. Each user is assigned a Distinct ID, which can be an email address, username, or system-generated ID. This ID is used to track and associate their actions across sessions. User profiles can include attributes like name, email, age, or subscription status.
Properties
Properties are attributes that provide additional context to events and users. Event properties offer details about an event, such as the item name, price, or payment method for a purchase. User properties describe characteristics of the user, like location or preferred language. Properties enable the creation of cohorts, which are groups of users defined by shared criteria, such as those who signed up in the last 30 days or users who have completed a specific action multiple times.
Warehouse Connectors
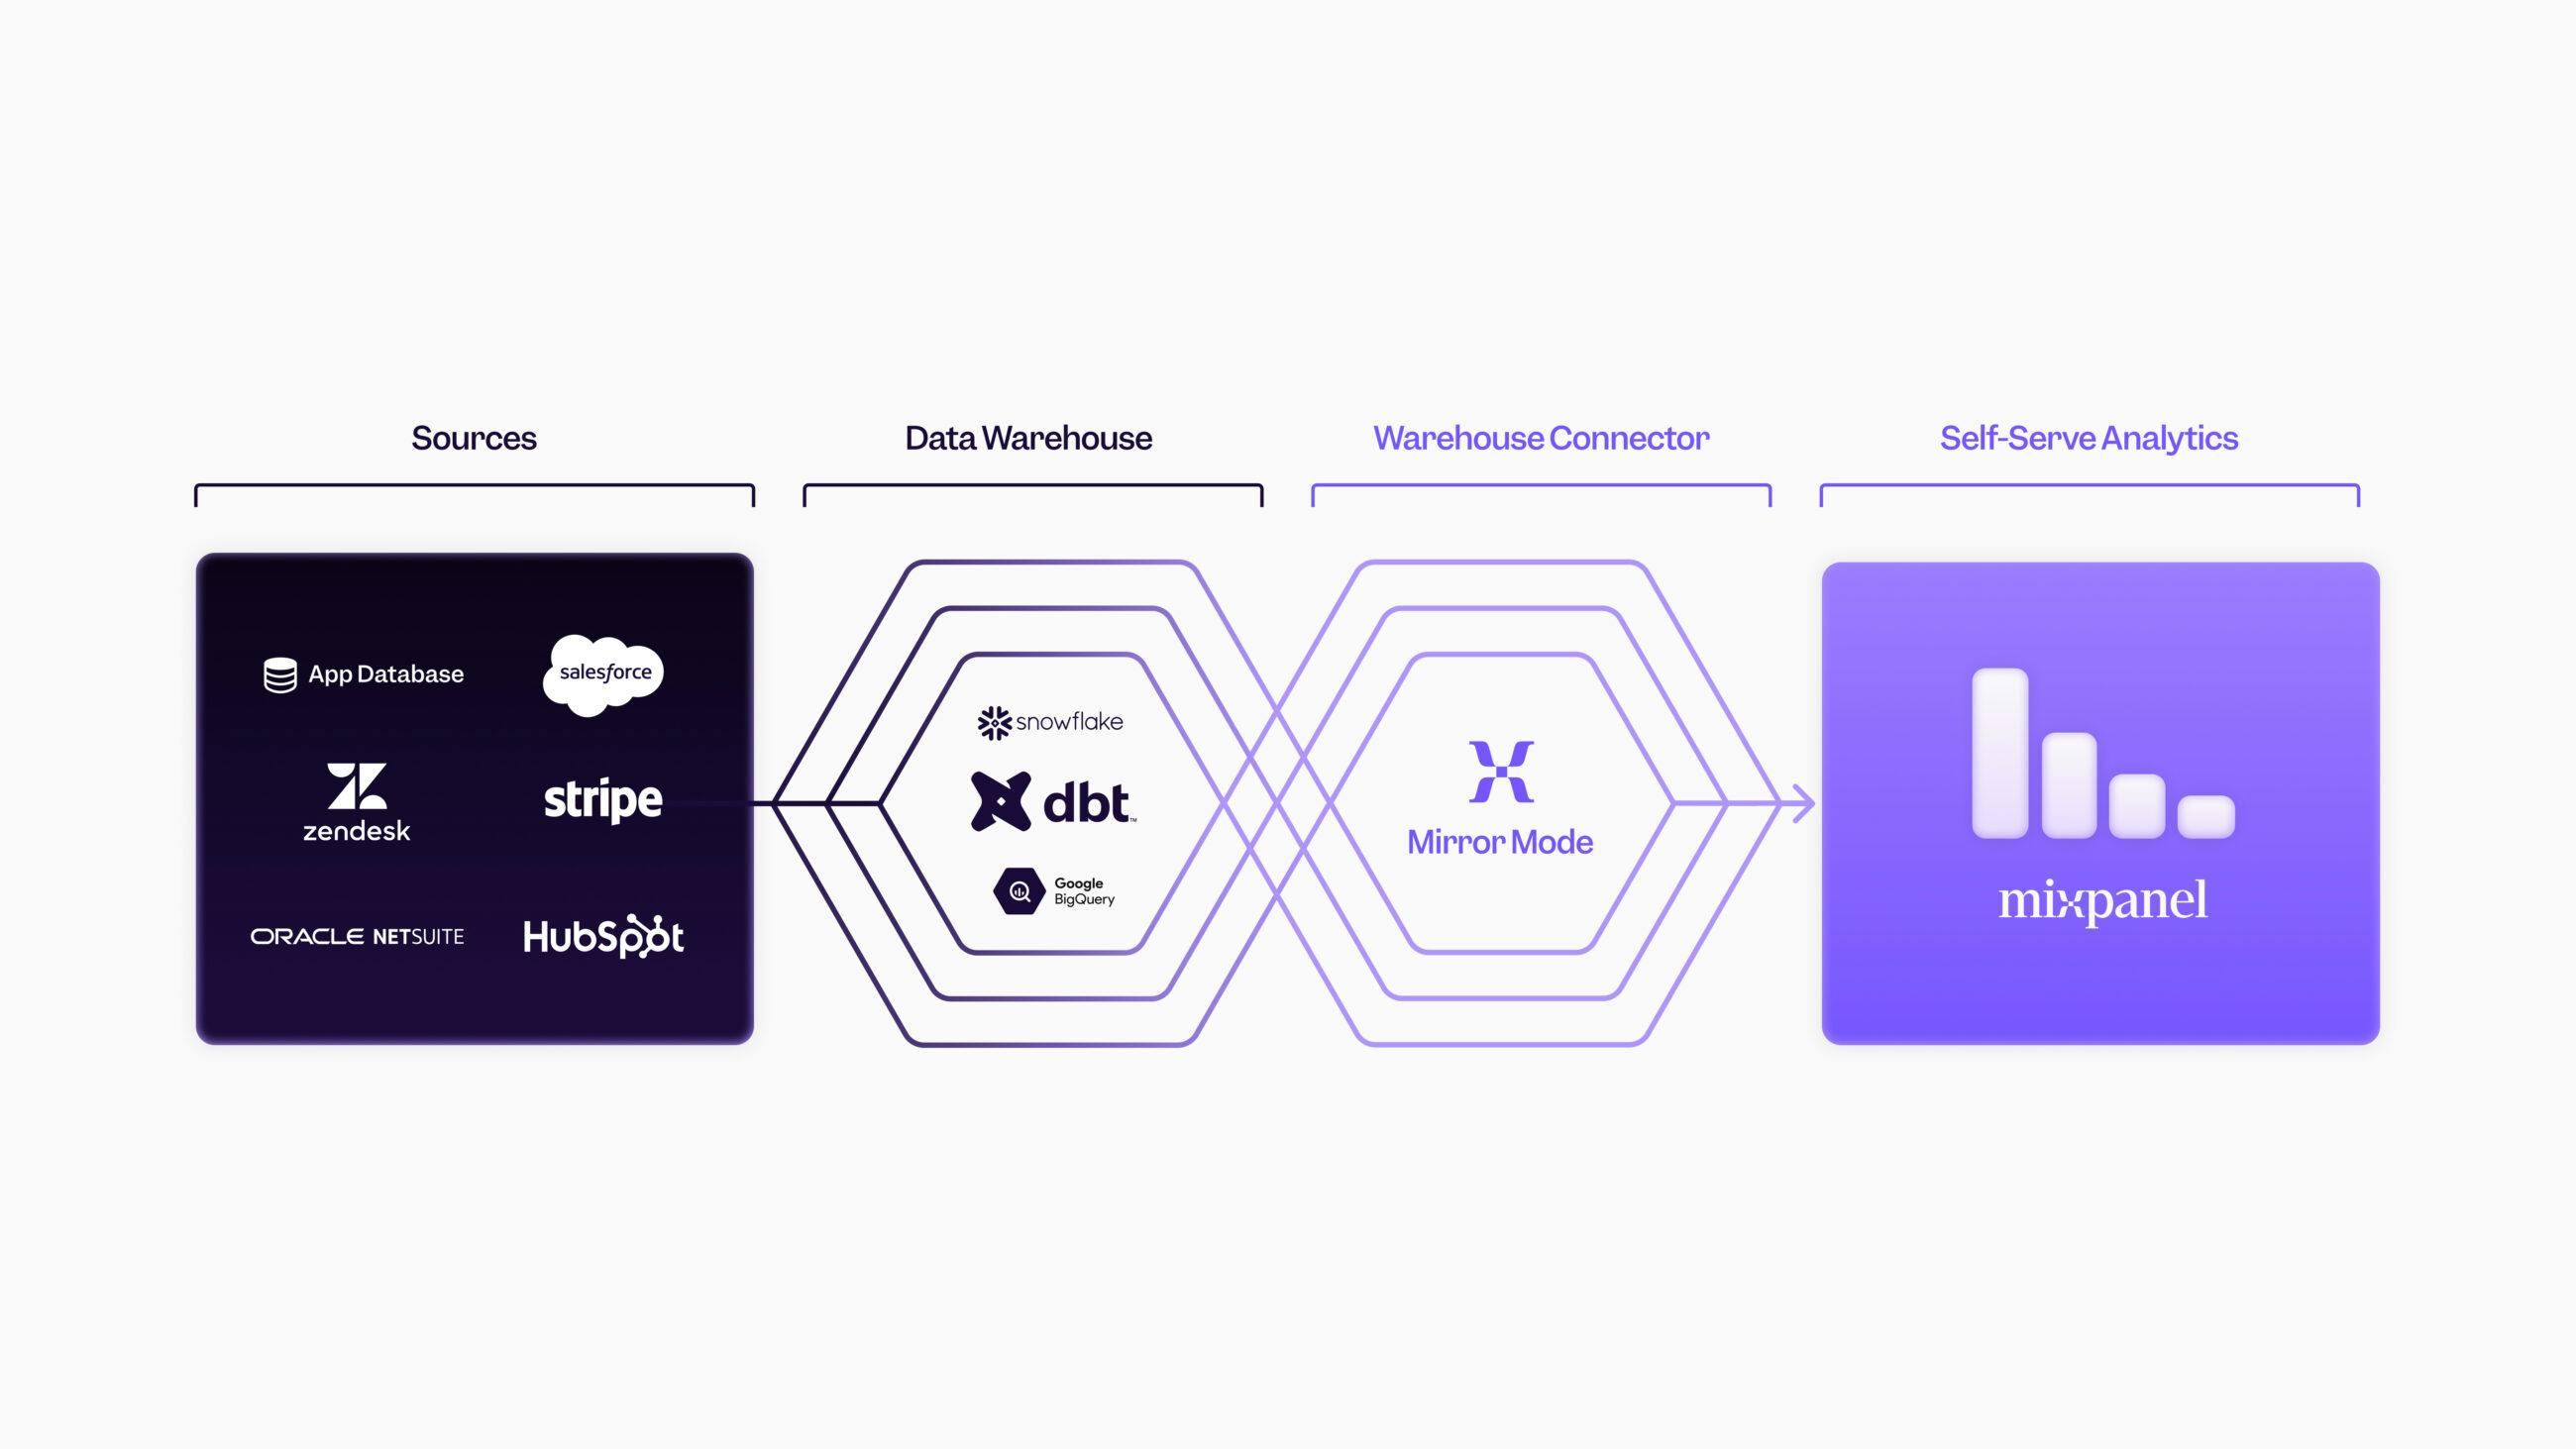
Source: Mixpanel
Mixpanel’s Warehouse Connectors enable integration between a data warehouse and the analytics platform. By connecting data warehouses such as Snowflake, BigQuery, Databricks, and Redshift, users can import and analyze a wide range of data, including CRM, marketing, transactional, and support data, alongside product interaction data. Performance is optimized through Mixpanel’s purpose-built database, Arb, which runs complex queries faster and at a lower cost than traditional data warehouses.
In June 2024, Mixpanel introduced Warehouse Connectors 2.0. A key feature of this release was Mirror mode, which introduced new sync capabilities that ensure any updates in the user's data warehouse are automatically reflected in Mixpanel through change data capture (CDC). This means that whether the user is making iterative changes, renaming or modifying columns, or reconciling transactions, Mixpanel will consistently mirror these updates over time.
Session replay
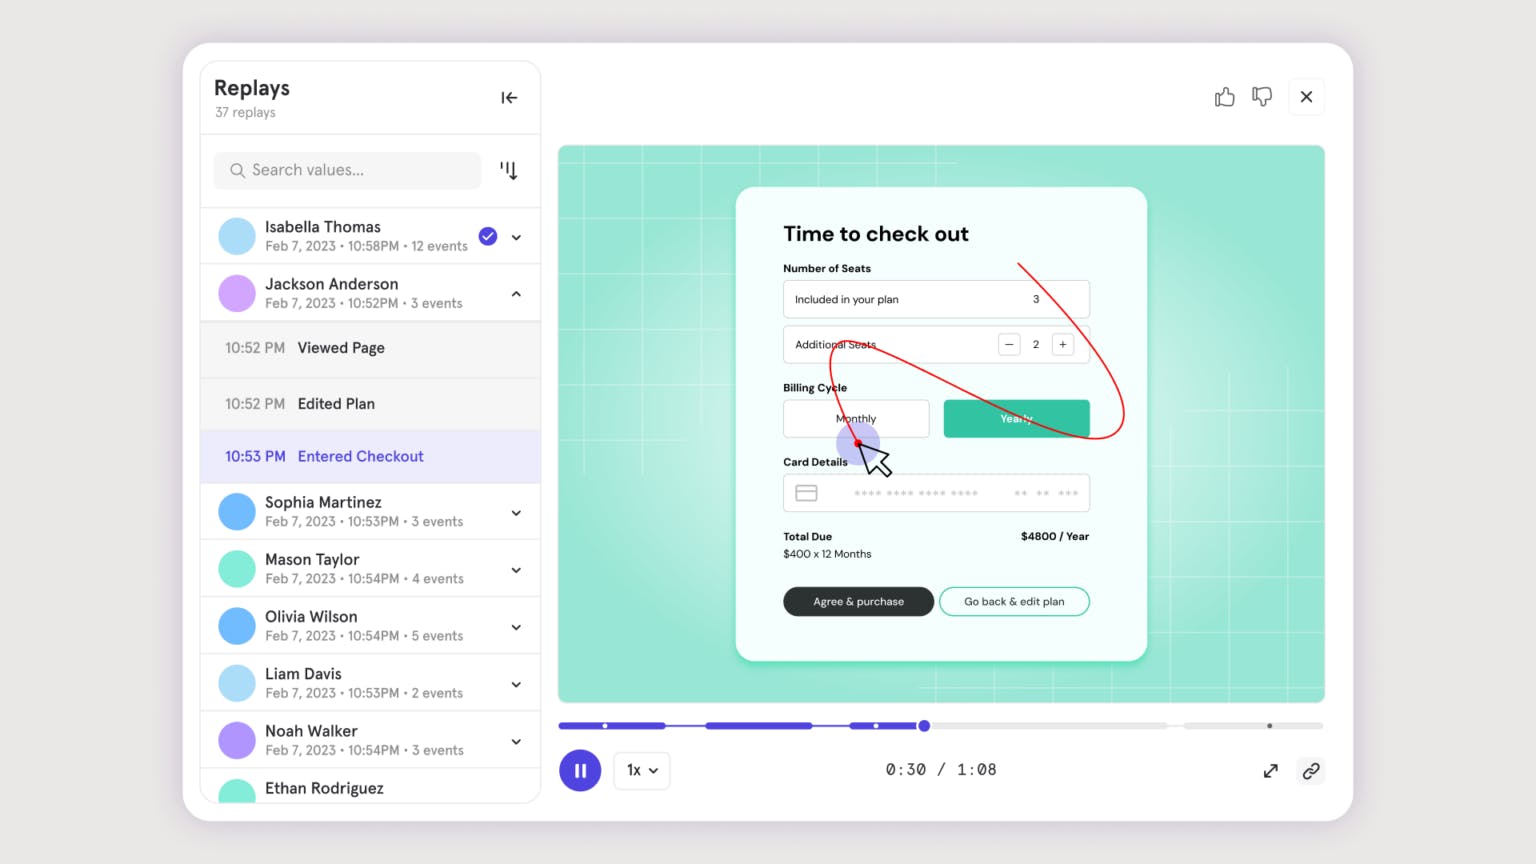
Source: Mixpanel
Mixpanel's Session Replay feature enables product teams to gain an understanding of user interactions by combining quantitative data with qualitative insights. Instead of recording users' screens directly, Session Replay reconstructs sessions by capturing changes to the Document Object Model (DOM) during user interactions. This approach allows teams to visualize user experiences without compromising privacy. By default, inputs and page text are masked, and images/videos are blocked, but teams can selectively unmask/unblock.
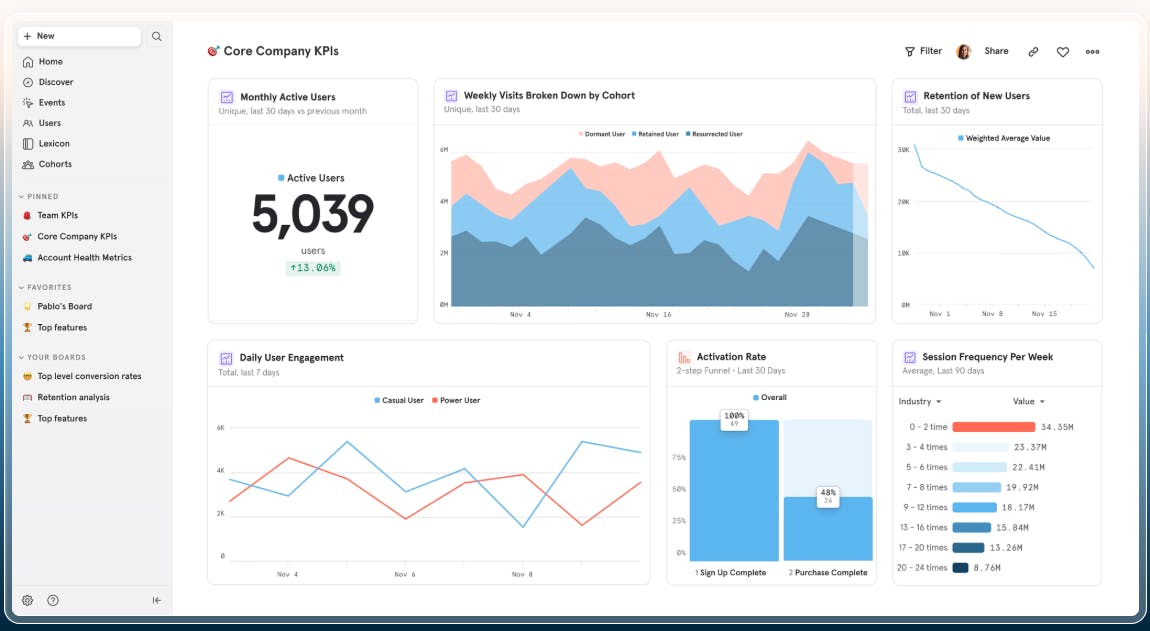
Custom Reports and Dashboards
Source: Mixpanel
With Mixpanel’s reporting tools, teams can build custom dashboards that visualize key performance indicators (KPIs) in real-time. Whether it’s tracking conversion rates, analyzing drop-off points in funnels, or comparing cohort behaviors, these interactive reports make complex data more accessible and actionable for the entire team. Users can also add text and media cards, such as images or videos, to provide context or highlight specific insights.
Mixpanel has made dashboards the central hub for analysis, allowing users to create and organize reports directly within them. This change simplifies workflows by grouping related reports together, making it easier to interpret data and share insights across teams.
Integrations
Mixpanel integrates with various tools and platforms to help businesses combine data sources, simplify workflows, and better understand user behavior. These integrations cover areas like customer relationship management (CRM), marketing automation, and data warehousing. For example, Mixpanel connects with CRM systems to sync user data, integrates with marketing tools to improve campaign effectiveness, and links with data warehouses for comprehensive analysis.
This integration capability allows teams to create a centralized analytics ecosystem where data flows seamlessly between systems. Examples of integrations include Google Cloud, Braze, Figma, Hotjar, and Segment.
Spark AI
Source: Mixpanel
Spark enables users to interact with their data using natural language. This allows users to generate reports and visualizations without knowing SQL or identifying data events. By typing questions in plain English, users can obtain insights into metrics, for example, “What does our signup trend look like in the past year, broken down by geo?”. Spark also gives the user the ability to view and modify the underlying queries it generates, ensuring a clear understanding of how the insights are produced. Mixpanel’s CEO, Amir Movafaghi, explains the importance of being able to modify the queries and reports Spark generates:
“This transparency is how we’re making generative AI in Mixpanel a powerful and instructional aid to your workflow rather than a feature that can only be trusted to take you so far.”
However, Spark AI is designed to handle objective queries that involve calculations or data modifications. It does not support subjective "why" questions, such as "Why are users purchasing fewer items this month?”.
Market
Customer
Mixpanel’s customers are typically digital product businesses that want to understand user behavior deeply. This spans a broad range of companies, from early-stage startups to large enterprises. Mixpanel’s product is suitable for a wide range of industries, including healthcare, finance, ecommerce, media, and B2B SaaS. Common applications include making product decisions faster, having one centralized data source for various teams, and using data for deciding product redesigns.
Customers often talk about Mixpanel's importance in making their companies more data-driven. Aaron Stillman, Vice President of Product Marketing & Education at AB Tasty, highlighted Mixpanel’s impact on AB Tasty’s product strategy:
“Without Mixpanel we would be less efficient in making our data actionable, which would have all sorts of ramifications impacting our growth. From our product-led growth strategy to our product development lifecycle and strategic roadmap planning, Mixpanel is critical to our success.”
There are several success stories where Mixpanel has both increased key metrics and lowered cost. Examples include ATB Financial, which achieved a 5% improvement in conversion rates, leading to monthly savings of $120K in operating revenue and a 13% increase in mobile engagement. The media company Bilyoner boosted daily active users by 15%, achieved a 94% monthly retention rate, and reduced customer acquisition costs by 40%.
As of August 2025, notable customers include Netflix, Ticketmaster, Yelp, and Uber.
Market Size
Product analytics
The primary market Mixpanel operates in is the product analytics market. This market is projected to grow from $9 billion in 2023 to $30 billion by 2032, with a CAGR of 15% during that time. This growth is fueled by factors like the rise of mobile apps and ecommerce, widespread digital transformation initiatives, and a competitive imperative for companies to improve user experiences with data-informed decisions. As more services move online and competition intensifies, organizations increasingly need sophisticated analytics to track user journeys, boost conversions, and retain customers.
Business intelligence
Mixpanel’s capabilities extend into BI by transforming raw data into strategic insights that guide decision-making across organizations. The business intelligence (BI) market is projected to expand from $33 billion in 2024 to $78 billion by 2032, reflecting a CAGR of 13% during this period. The growth of the market is primarily driven by the expansion of big data and the adoption of cloud computing.
Competition
Google Analytics: Google Analytics is a web analytics service developed by Google that tracks and reports website traffic and user behavior. It was launched in November 2005 following Google's acquisition of Urchin Software Corporation in April of that year. Urchin was a web statistics analysis program that processed web server log files to display traffic information. This acquisition laid the foundation for what would become Google Analytics. In October 2020, Google released Google Analytics 4 (GA4), emphasizing event-based data collection and enhanced user journey tracking across platforms. As of 2025, 55.5% of all websites globally use Google Analytics.
While Mixpanel and GA4 are both event-based, GA4 is optimised for marketing traffic attribution across websites and apps. Mixpanel goes deeper on product-level behavioural analysis like cohorts, retention, and in-app conversion, and offers richer querying for SaaS and mobile-first products.
Amplitude: Founded in 2012, Amplitude is a digital analytics platform designed to help businesses deeply understand user behavior, enabling informed decisions to improve product experiences. Amplitude’s platform also tracks in-app user events and offers similar features to Mixpanel (funnels, retention analysis, cohorts), with an emphasis on predictive analytics. In May 2022, it launched customer data platform (CDP) capabilities. Amplitude went public in September 2021, recorded $312 million of revenue in 2024, and had a market cap of $1.5 billion as of August 2025.
The two products have broadly similar features, with both Amplitude and Mixpanel having freemium models and basic product analytics features like session replays, event tracking, and experiment analysis. Amplitude, however, positions itself as a complete digital analytics platform, including a CDP, while Mixpanel is more single-mindedly focused on product analytics.
Heap: Founded in 2013, Heap is a digital insights platform that enables businesses to understand and optimize user interactions across their websites and mobile applications. Heap raised $110 million at a $960 million valuation in a Series D round in December 2021. Contentsquare acquired Heap in December 2023 at an undisclosed valuation.
Heap pioneered automatic event capture, with Heap’s product recording all user interactions, such as clicks, page views, and form submissions, by default. This allows analysts to retroactively define events without pre-planning tracking and differs from Mixpanel’s approach, where you typically instrument events upfront.
Pendo: Founded in 2013, Pendo combines product analytics with in-app guides, feedback, and digital-adoption tooling. It raised $150 million at a $2.6 billion valuation in a Series F round in July 2021, led by B Capital. In March 2024, Pendo disclosed passing $200 million in ARR.
Both Mixpanel and Pendo begin with event analytics and a freemium model, but Pendo bundles guidance (e.g, walk-throughs, in-app messaging) and session-replay, targeting teams that want a broader “product experience” platform. In contrast, Mixpanel is more narrowly tailored to traditional product analytics use cases.
Business Model
Source: Mixpanel
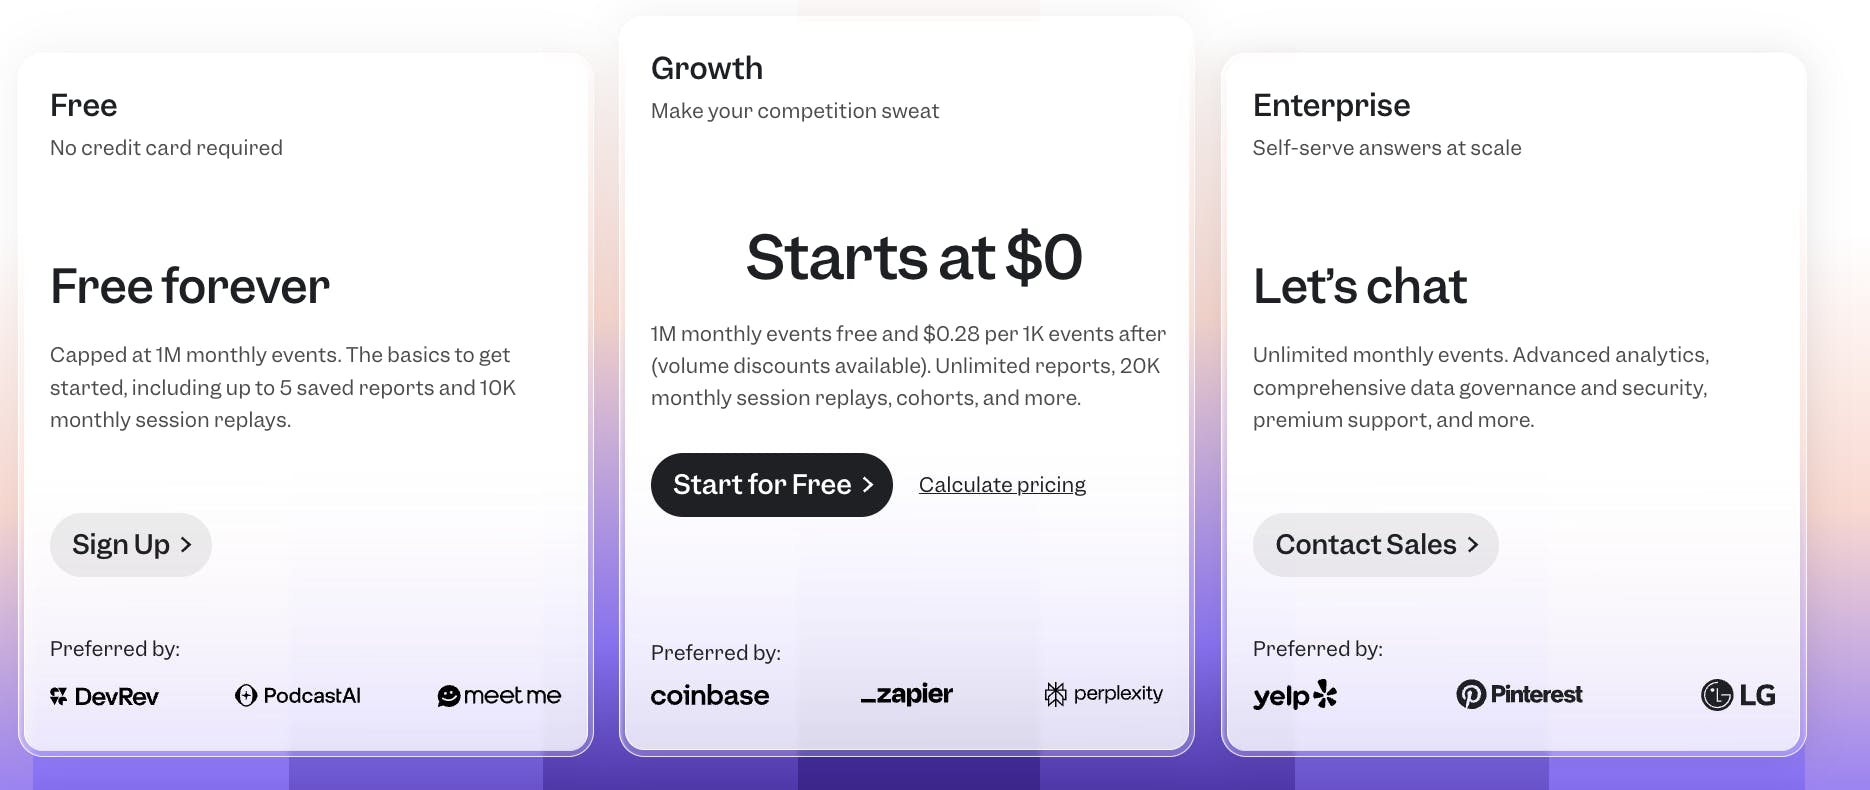
Mixpanel is a B2B SaaS company using a freemium business model with three pricing tiers: Free, Growth, and Enterprise. All plans have unlimited seats and are priced based on usage.
The free plan includes up to 1 million monthly events, analytics reporting, templates, 10K monthly session replays, and access to Mixpanel’s Slack group.
The growth plan starts at $0 per month and costs $0.28 per 1K events above 1 million, with a cap of 20 million monthly events. It also offers everything in the free plan, plus unlimited reports, 20K monthly session replays, and complete cohorting analysis.
Mixpanel’s enterprise plan is designed for businesses needing more advanced features and more events (up to 1 trillion per month). For the enterprise plan, all features in Growth are included, plus data warehouse ingestion, data governance and access controls, automated provisioning and SSO, custom session replay volumes, premium support, and professional services.
Mixpanel also offers an incentive for startups through its Startup Plan. Companies founded within the last five years and with less than $8 million in total funding are eligible for 1 year free on the Startup Plan.
Traction
By 2018, Mixpanel had reached about $100 million in annual revenue. Mixpanel has not released any additional revenue data as of August 2025.
As of November 2022, Mixpanel had 6K paying customers. As of August 2025, Mixpanel had 8K paying customers and 29K customers overall. Its 2024 Benchmarks report said Mixpanel processed over 11.7 trillion user events in 2024.
Valuation
Mixpanel has raised $277 million in total funding as of August 2025. In November 2021, it raised a $200 million Series C at a $1 billion valuation, led by Bain Capital Tech Opportunities. In December 2014, it raised $65 million at an $865 million valuation in a Series B round led by Andreessen Horowitz. In May 2012, Mixpanel raised $10.3 million in a Series A round led by Andreessen Horowitz. In February 2010, Mixpanel raised $500K in Seed funding from Max Levchin and Michael Birch.
Key Opportunities
Experimentation
There is an opportunity for Mixpanel to expand into running experiments directly, similar to what direct competitors like Amplitude have done. Amplitude’s experimentation product combines first-party feature flags with A/B, multivariate, and bandit testing and is tightly integrated with its analytics suite. In October 2024, Amplitude added Web Experimentation, a visual editor that lets non-technical users run web A/B tests and page personalizations without code. Today, Mixpanel primarily serves as the analysis layer for experimentation. It ingests exposure events from external flagging tools like LaunchDarkly and provides experiment readouts, but it does not natively handle variant assignment or flag rollouts.
The experimentation software market is small but growing. It is estimated to be $1.2 billion in 2023, but it is expected to grow to $4.5 billion by 2032. If Mixpanel expands into experimentation, it can increase the value of its platform compared to other product analytics competitors.
AI to Simplify Product Analytics
Recent advancements in AI present an opportunity for Mixpanel to differentiate and add value on top of its rich dataset. Mixpanel already uses AI for natural language querying. It offers Spark AI, which allows users to interact with their data through text-based queries. This functionality enables team members to generate detailed reports and visualizations without the need for SQL knowledge or deep familiarity with data structures.
Mixpanel can further integrate AI to surface insights automatically. This could mean using anomaly detection to alert teams when a metric deviates, or clustering user behavior patterns that aren’t obvious via manual slicing. For example, Mixpanel could deploy an AI assistant that scans your data and tells you, “Users who do X action are three times more likely to convert than others,” or “Feature Y usage is dropping among premium customers.” Such features would save analysts time and potentially uncover opportunities or issues that would be missed with standard dashboards.
Key Risks
Competitive Market
The flip side of the growing market is that competition is fierce, and the product analytics market is highly competitive. Direct competitors like Amplitude and Heap are well-funded and have been aggressively building out their products. Amplitude’s public status also gives it capital and visibility to win bigger enterprises. If Amplitude or others develop features faster, like better AI-driven insights or integrated workflows, Mixpanel could lose its edge.
There’s also the risk of pricing pressure with players like PostHog offering cheaper or free open-source alternatives. Additionally, large cloud companies could integrate more analytics capabilities into their ecosystems, given that Google already has Google Analytics and AWS has QuickSight. Although their products are not always directly comparable to Mixpanel, these companies all have the potential to encroach further on Mixpanel’s territory.
Mixpanel has seen competitive challenges before. In 2018, Mixpanel “lost focus” and was “losing customers”, with a Net Promoter Score of only 15.
Privacy Regulations and Data Ownership
As a company dealing with user-level data, Mixpanel faces regulatory and privacy risks that are growing globally. Laws like GDPR in Europe, CCPA in California, and others worldwide put constraints on collecting and storing personal data. Mixpanel’s analytics often involve user identifiers, event properties, and possibly sensitive behavior data. Clients rely on Mixpanel to handle this data in compliance with the law. Any misstep (e.g., a data breach or non-compliance issue) could not only incur fines but also erode customer trust: Companies might hesitate to use third-party analytics if they fear regulatory fallout.
Additionally, users (end-consumers) are becoming more privacy-conscious, using ad-blockers or opting out of tracking. Technologies like Apple’s iOS privacy changes (App Tracking Transparency) don’t directly shut down first-party analytics, but they signal a trend: data collection is getting more challenging. Mixpanel will need to continuously adapt, for instance, by providing tools for anonymization, consent management, and giving end-users control. If privacy trends continue, one could imagine stricter rules on data retention or requiring analytics data to stay within a company’s own servers (especially in certain industries like healthcare or finance).
Summary
Mixpanel is a product analytics platform designed to help companies track and analyze user behavior, enabling businesses to make data-driven decisions with a clear focus on event-based tracking. Founded in 2009, Mixpanel has been supported by the growing demand for product analytics tools as more companies undergo widespread digital transformation initiatives across their websites and mobile apps. It has over 8K paying customers as of August 2025 and reached $100 million in annual revenue in 2018.
Mixpanel’s opportunities are in riding the continued shift to event-based, first-party product analytics by an increasing number of companies and using AI to make analysis more self-serve. But it also faces risks from intense competition from pure plays, incumbents, and open-source alternatives, as well as privacy and platform changes that make data collection more challenging.