Thesis
The complexity of data infrastructure has grown alongside the adoption of cloud systems, driven by the enhanced scalability and performance in data processing and storage. As of 2023, 67% of enterprise infrastructure was cloud-based. The performance of compute systems per dollar invested has doubled every 2.5 years between 2006 and 2021. Storage expenses have experienced an 800x reduction from 2000 to 2023. As a result, the volume of data processed by businesses has increased and is expected to swell to 612 zettabytes by 2030. This transformation underscores the critical role of data in driving business decisions and processes.
However, data used by companies is not always accurate. As of 2019, one in five companies had lost customers due to erroneous data. Data and AI teams spent twice the amount of time on data downtime year-over-year in 2023. Poor data quality costs organizations, on average, an annual loss of $12.9 million as of 2021. For example, in 2022 Unity Software reported a loss of $110 million in revenue due to “ingesting bad data from a large customer.” As a result, data employees have been spending half their time fixing data issues for years. A new wave of data monitoring tools has emerged to help users trust their data quality and reliability.
Monte Carlo is a platform for end-to-end data observability – a term coined by its CEO – to help organizations monitor abnormal patterns in their data. Data observability refers to an organization’s ability to understand its data by monitoring its volume and quality as it moves through data pipelines. Similar to how observability helps DevOps teams monitor system health, data observability does the same for DataOps teams. It helps them automate monitoring, alerts, and issue handling to keep track of data health. This method flags inaccurate data before it flows downstream into systems like data warehouses and AI models.
Founding Story
Bar Moses (CEO) founded Monte Carlo in 2019 with Lior Gavish (CTO).
Moses met Gavish at Stanford, where she studied computational science while he studied for his MBA in 2010. Before college, she worked in data analysis in the Israeli Air Force, which inspired an early interest in automating data tasks. After Stanford, she worked at Bain Consulting and later joined GainSight, where she became VP of Customer Operations. During her tenure, she saw how inaccurate data would negatively impact the trust of key stakeholders and customers. In 2012 Gavish co-founded Sookasa, a cloud security provider. Sookasa was later acquired by Barracuda in 2016, and Gavish worked at Barracuda as SVP of Engineering on ML products for fraud protection.
From her time at GainSight, Moses observed how her engineering counterparts had APM products, while data teams lacked equivalent tools to validate their work. Moses left GainSight in 2018 to start her own company and worked on three different company ideas. After talking to hundreds of data leaders about their pain points with data quality, she settled on Monte Carlo. From her experience working on data dashboards at GainSight, she dealt with challenges around data reliability: ensuring data accuracy and pinpointing the problem to figure out the path of resolution. Her user research with potential customers reinforced the need for a solution to data quality issues across an organization.
Moses and Gavish first focused on data problems closest to the end user, such as looking at reports, interpreting the output of models, or viewing a website. Another early problem they prioritized was tracking schema changes for data analysts. They talked with data leaders who identified data downtime and data quality issues as one of their top three pain points.
Product
Monte Carlo is a platform for data teams to ensure the reliability and accuracy of their data pipelines through continuous monitoring and testing. The product provides out-of-box coverage for a customer’s data stack, integrating end-to-end across cloud warehouses, lakes, ETL, and business intelligence tools. Monte Carlo’s system is API-based and connects to key data systems to collect metadata and statistics. Then, it reconstructs the data lineage to track the flow of data over time. Customers leverage field-level lineage to track how upstream changes in one system affect downstream dependencies in another.
Monte Carlo defines data observability with five main pillars:
Data Freshness: Whether the data arrived at an expected time
Data Volume: Whether tables are the right size
Data Schema: Whether the schema changed
Data Quality: Whether the values are outside of a known range
Data Lineage: Which upstream sources and downstream consumers were impacted when the data broke
Monte Carlo’s platform addresses each of these data observability components with key features including modules to monitor and understand (1) data assets, (2) data alerts & incident management, (3) data monitoring, (4) dashboards for broad data overviews, and (5) root cause analysis to drill down into specific issues for better understanding.
Assets
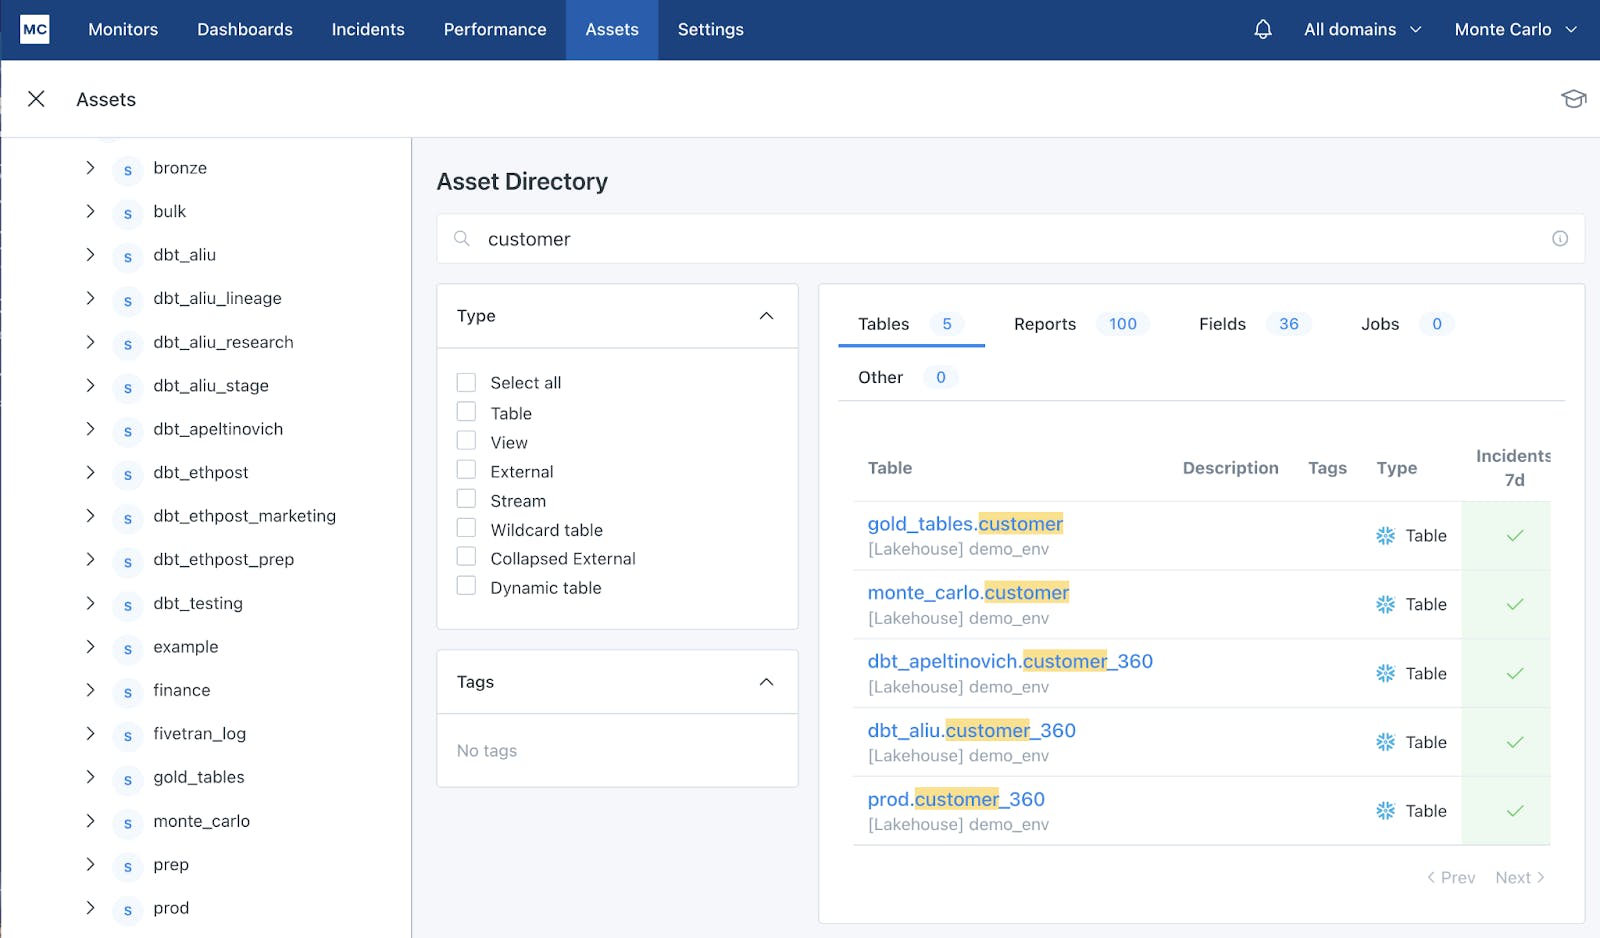
Source: Monte Carlo
Monte Carlo’s Assets module provides users with a management console to view all of the data assets that are connected to Monte Carlo. For each data asset users can view summary pages populated with metadata. Possible metadata includes table lineage, field lineage, query logs, freshness, and volume. Each asset also shows the normal patterns for a particular table. One example is the ability to map table lineage for each data asset, demonstrating how data is flowing into a data asset and where the data flows downstream.
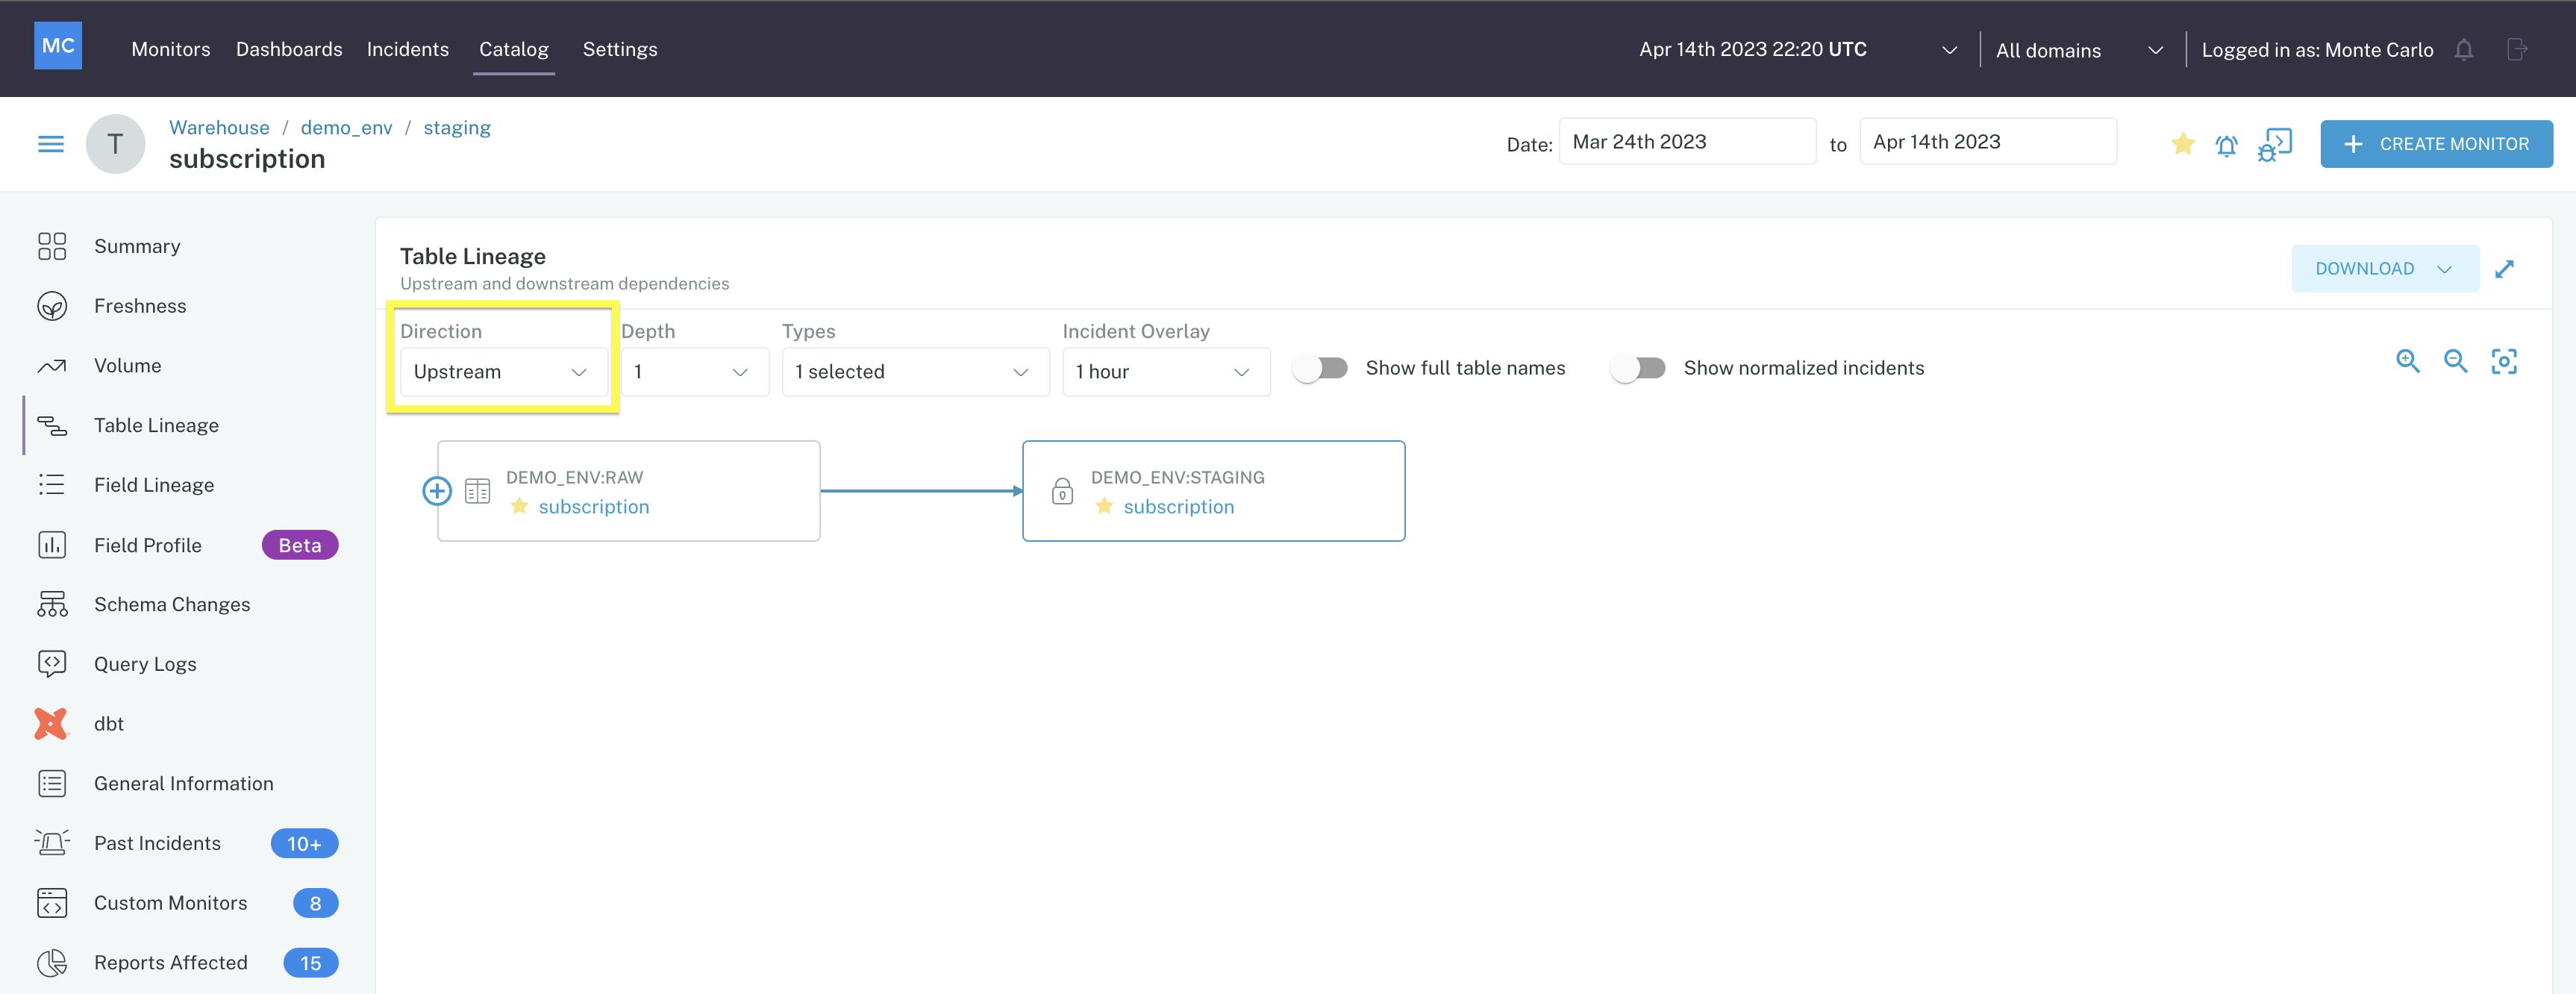
Source: Monte Carlo
In March 2024, Monte Carlo announced the launch of Data Explorer, “an interactive approach to profiling your data and investigating data quality issues.” This enables users to more easily drill into specific time periods, data segments, and relevant metrics without the friction of having to write SQL to perform ad hoc analysis.
Alerts
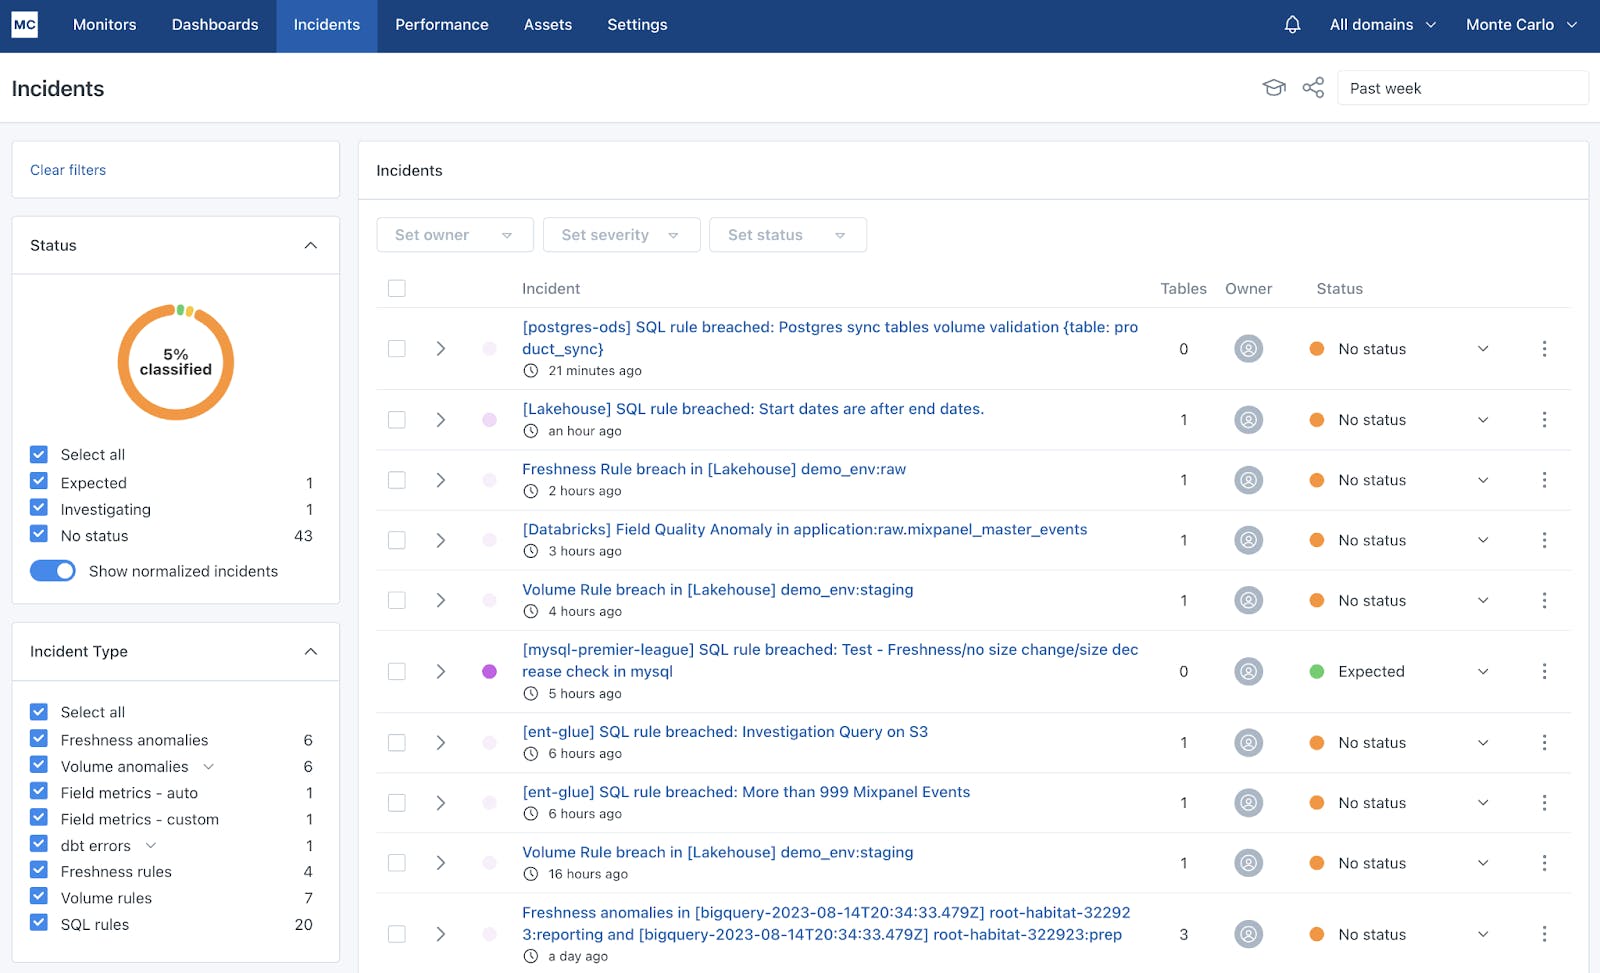
Source: Monte Carlo
Monte Carlo's incident management module helps users manage alerts in order to catch data anomalies, which are irregularities in a dataset that deviate from expected patterns. Examples of data anomalies could be abnormal delays in table updates, unexpected changes in table sizes, and unintended alterations in field structures.
For each alert, the summary tab informs the user of the issue and its impact and serves as the starting point for root cause analysis. It allows the user to see which data assets are affected by the data anomaly, queries that could have caused the anomaly, and BI reports that are at risk from the alert.
Monitoring
Monte Carlo offers a variety of monitors for data teams to observe the data pipeline. Teams can instantly deploy monitors based on specific metadata. They can also strategically deploy a deep quality monitor on important tables. For this case, ML models train on historical data to enhance the static thresholds that would be traditionally set by data teams. Teams can set custom models that use custom SQL queries to asses for business-specific anomalies and establish important metrics.
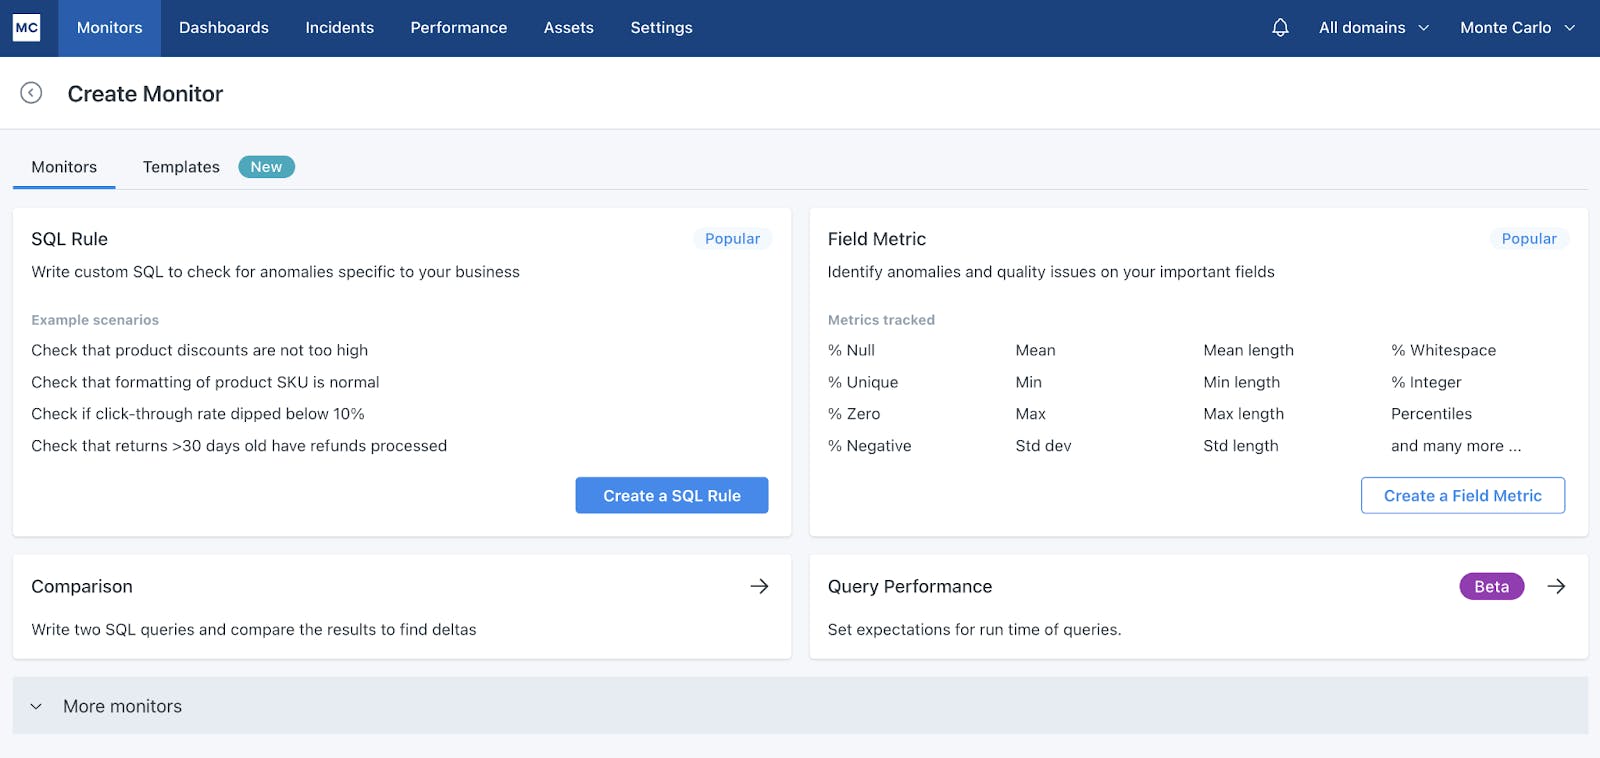
Source: Monte Carlo
In August 2024, Monte Carlo launched AI Monitor Recommendations. This feature enables users to view recommended monitors based on their individual data and use cases, and then with “one-click,” create those monitors. These recommendations are based on historical data patterns.
Dashboards
Monte Carlo's product provides data teams with enhanced visibility into the health and reliability of critical assets such as tables and training sets that drive their data products. It helps managers set goals for the data team by displaying key metrics about incidents, user adoption, and uptime. There are numerous applications for these dashboards across industries like finance, retail, and ecommerce, that all benefit from a comprehensive view of data quality.
Data Reliability Dashboard: This dashboard displays a high-level view of a customer’s data ecosystem. It reports on the number of incidents and tracks the frequency and time to resolution it takes for teams to respond to alerts.
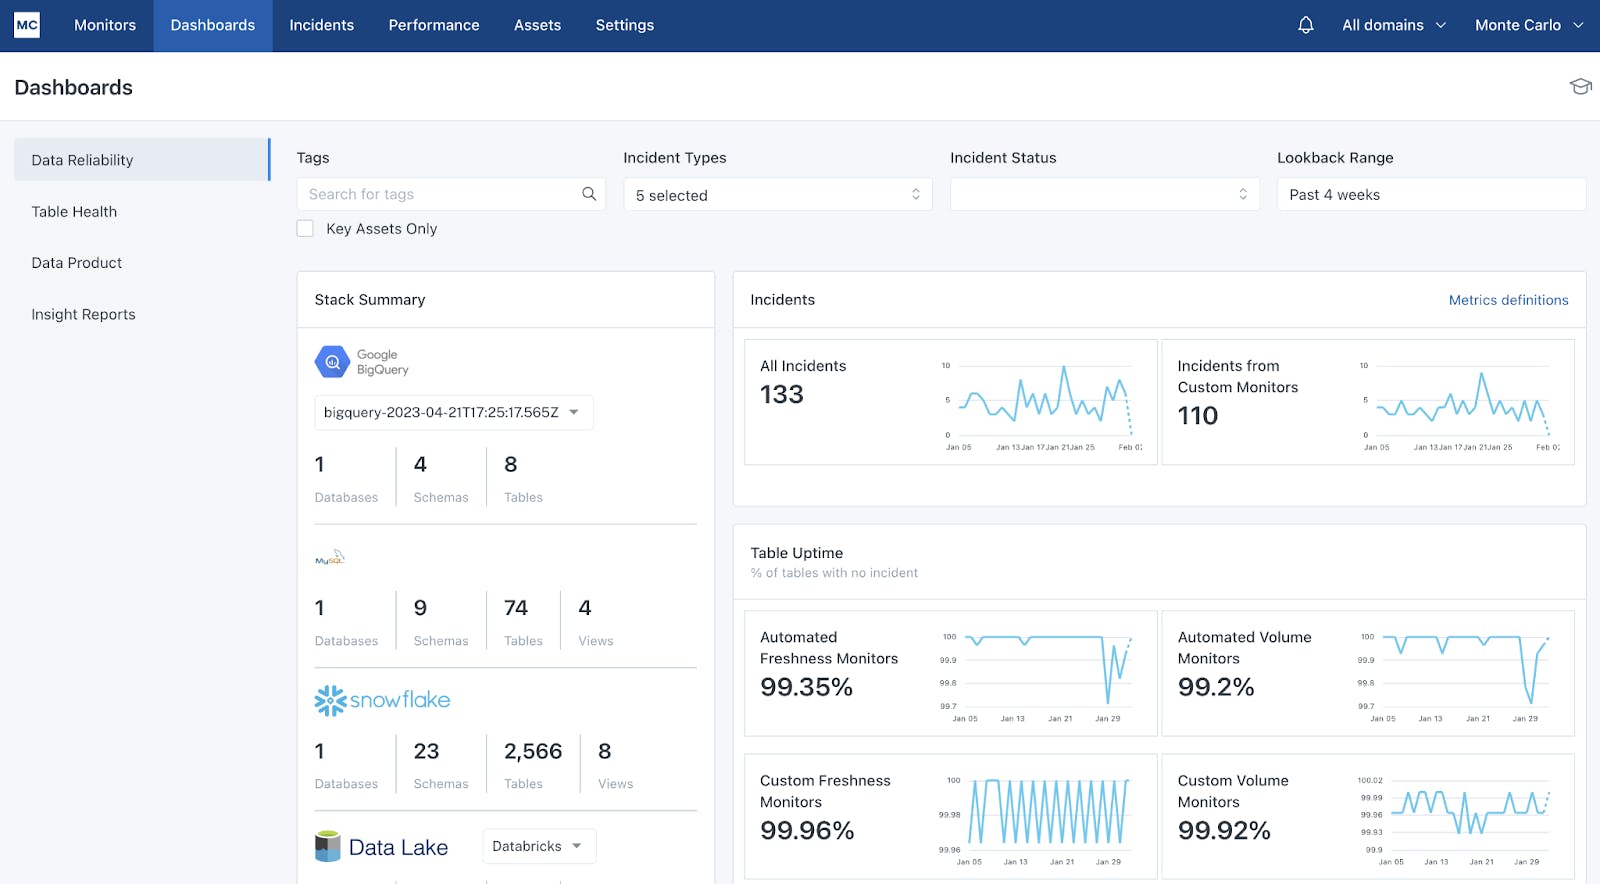
Source: Monte Carlo
Table Health Dashboard: This dashboard provides an overview of the data quality of all objects within a data lake or data warehouse. It identifies incidents and data anomalies caught by Monte Carlo, displaying the incident status and severity. Columns like SQL Rule, Freshness, and Volume indicate possible sources of data anomalies.
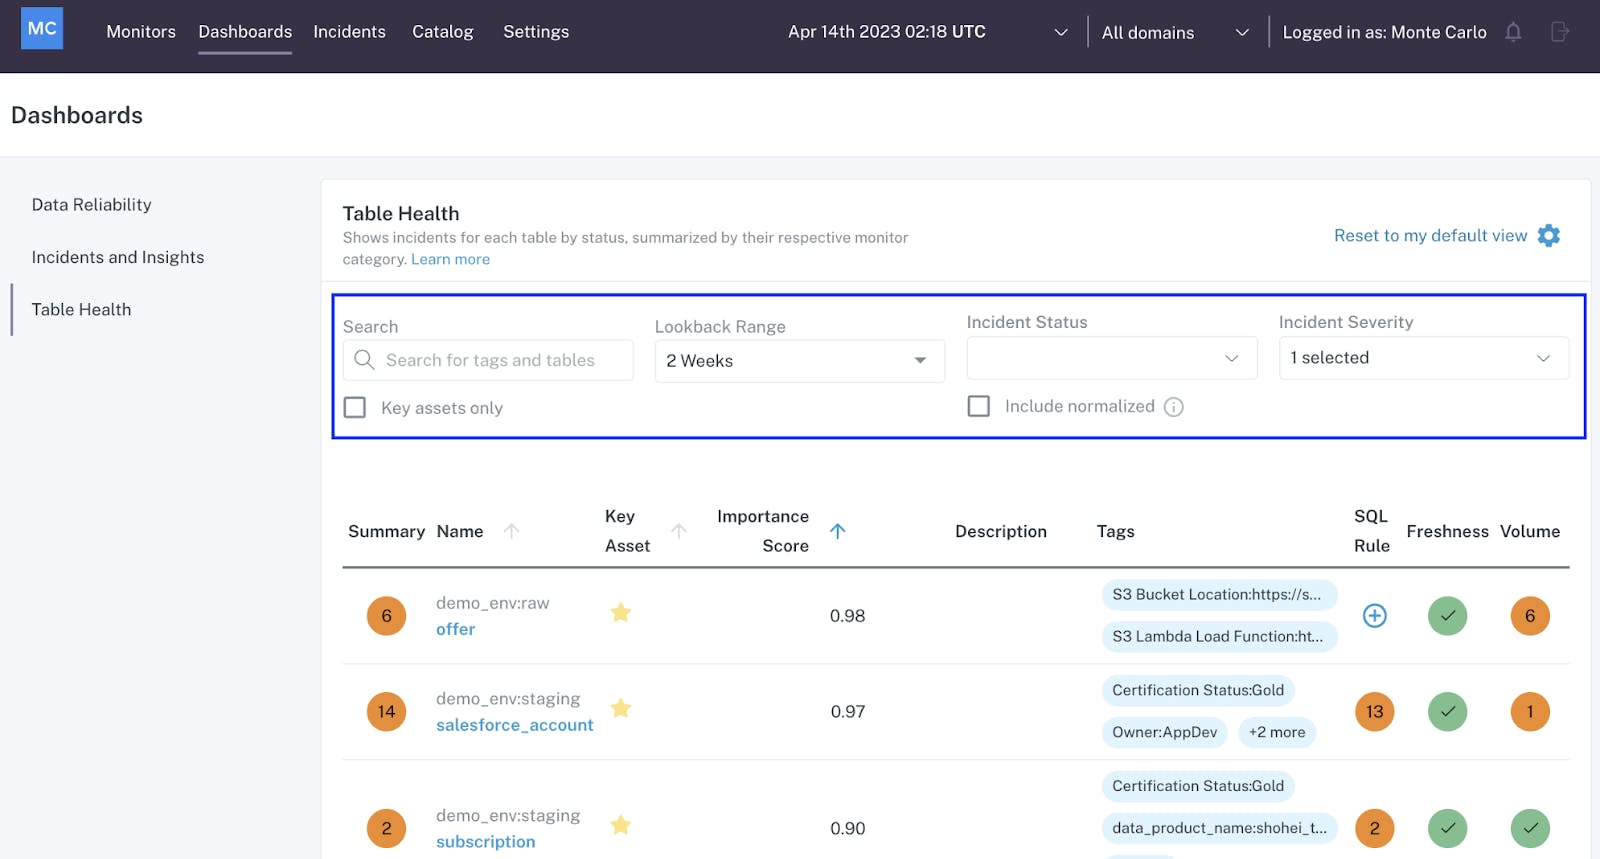
Source: Monte Carlo
Data Product Dashboard: This dashboard provides insight into downstream assets that serve as the core interfaces of a data product, such as tables, BI Reports, and Dashboards. For each asset, the Dashboard automatically upstream assets to provide a complete picture of its overall health.
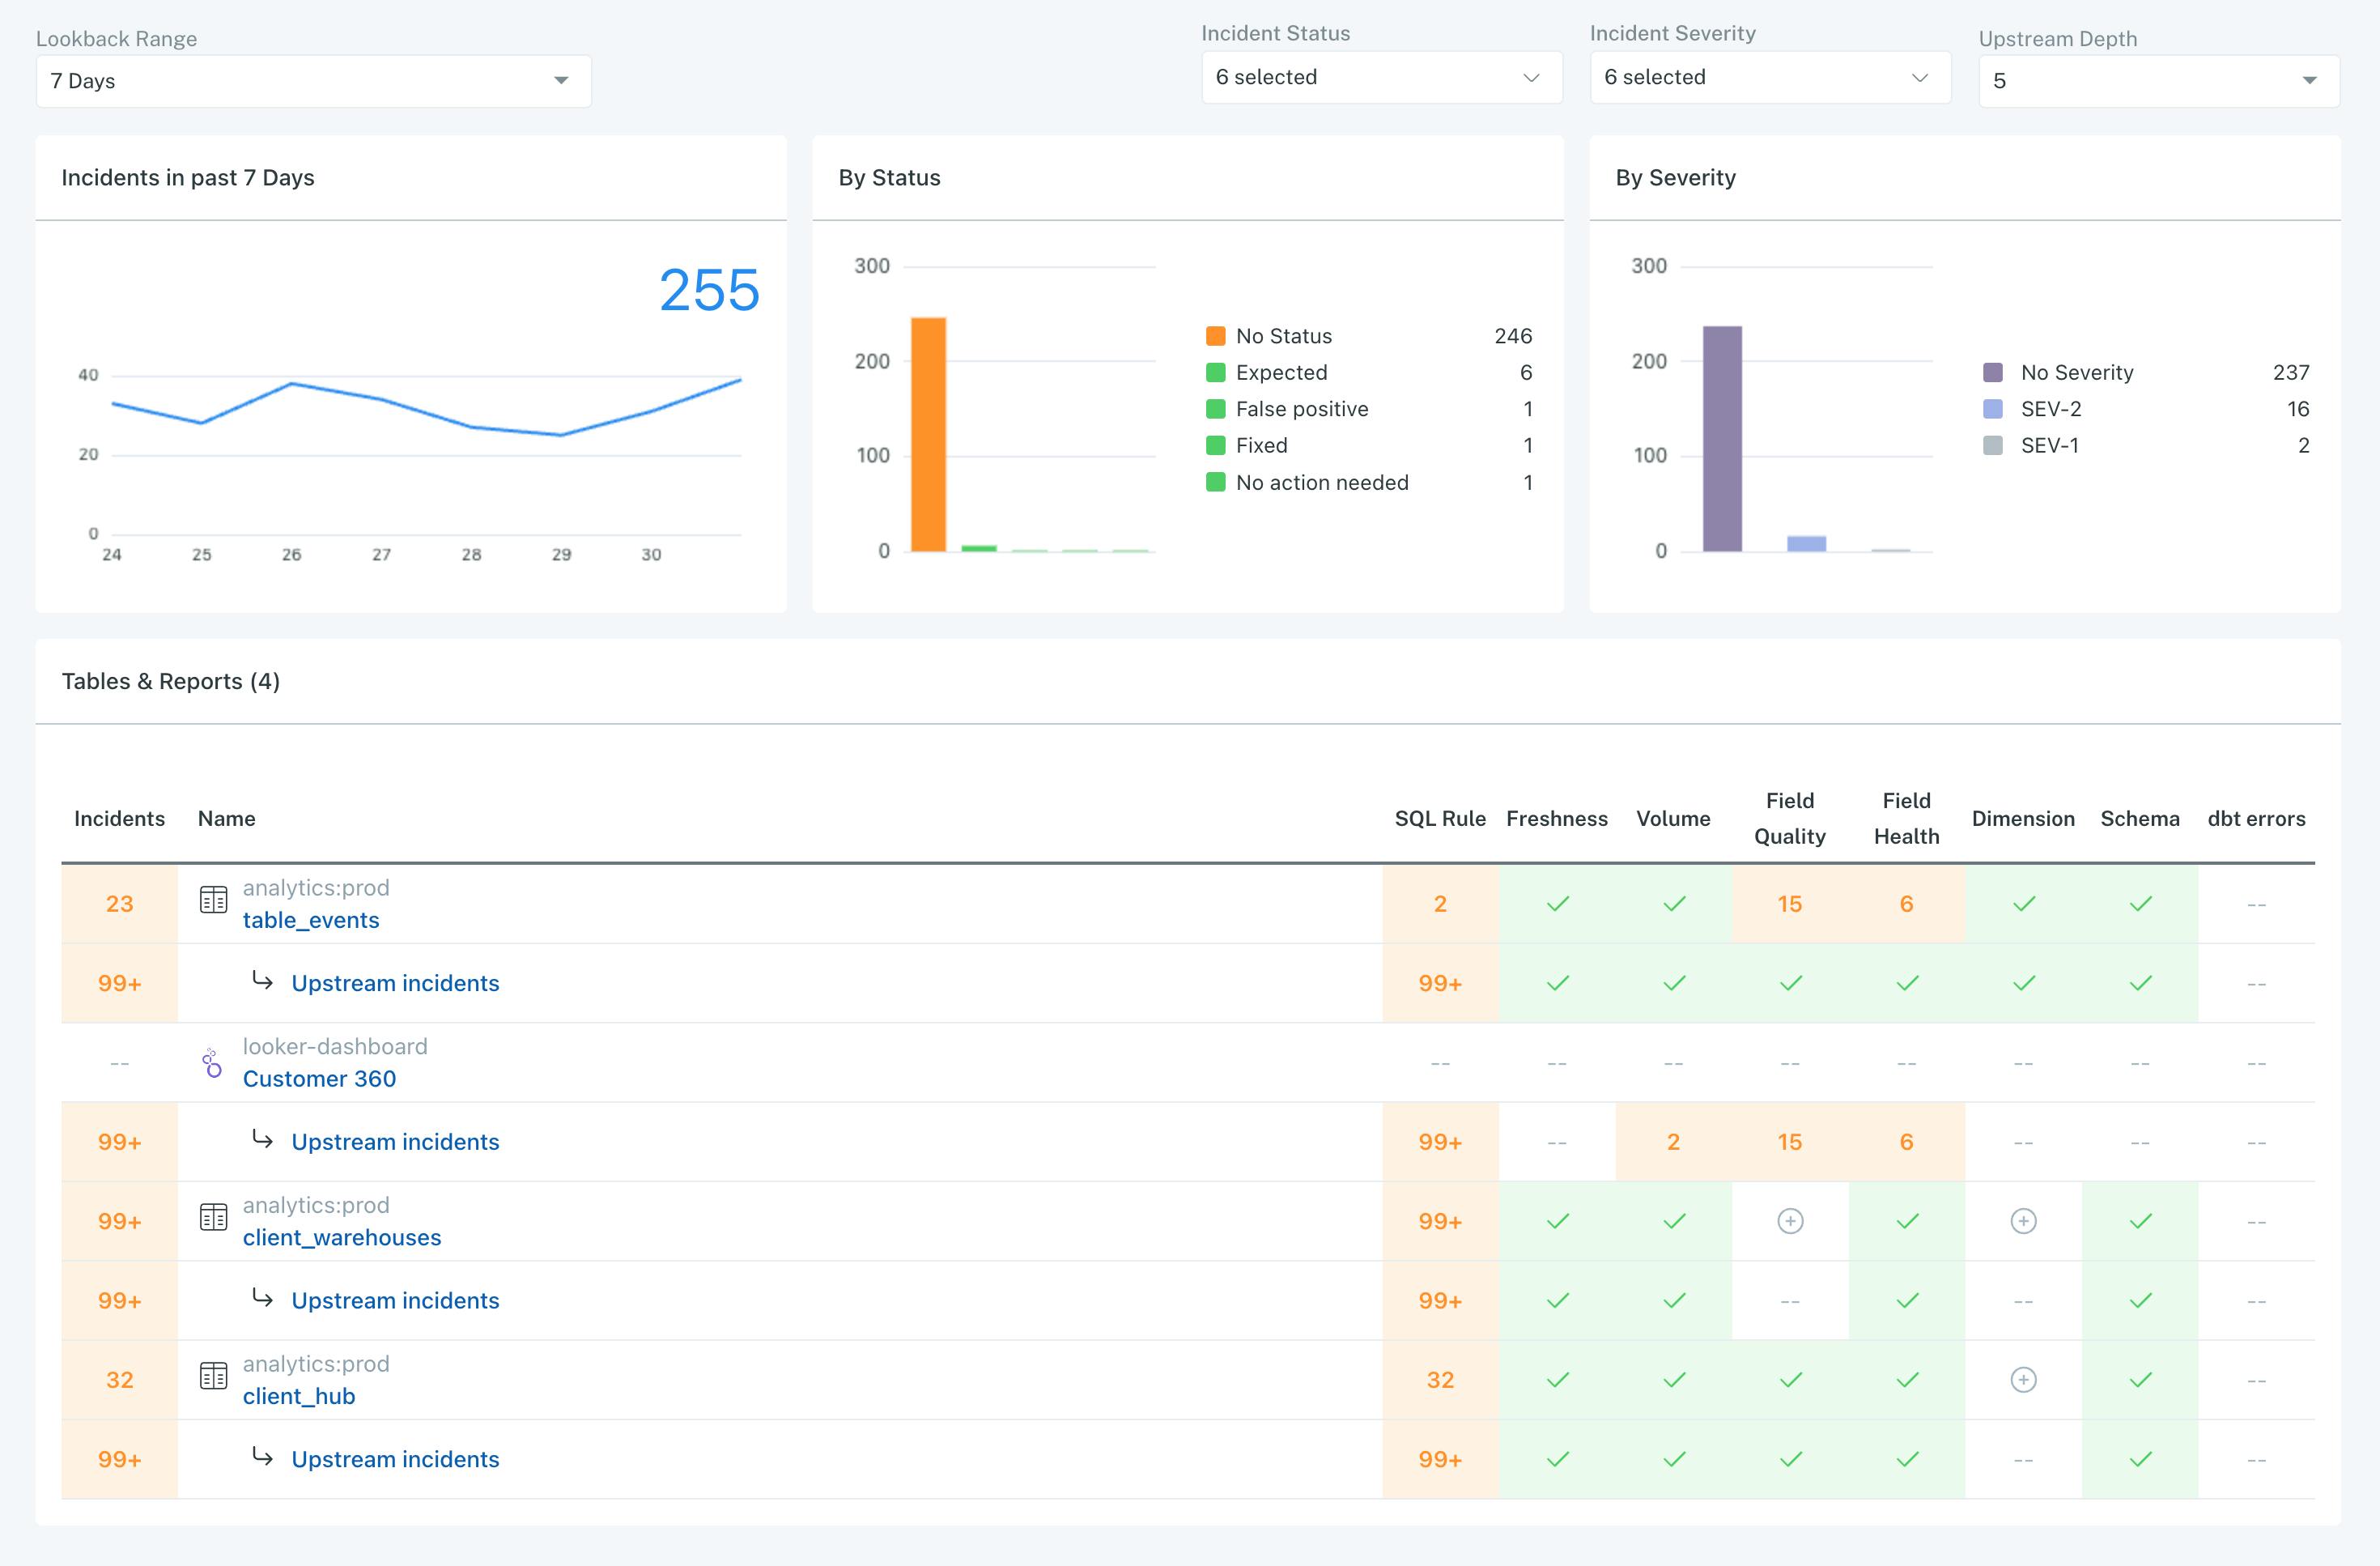
Source: Monte Carlo
Data Performance Dashboard: In August 2023, Monte Carlo launched a Data Performance Dashboard, which helps to identify queries that are unnecessarily long and therefore result in higher costs from data warehouses, like Snowflake. This dashboard addresses the broader need for FinOps.
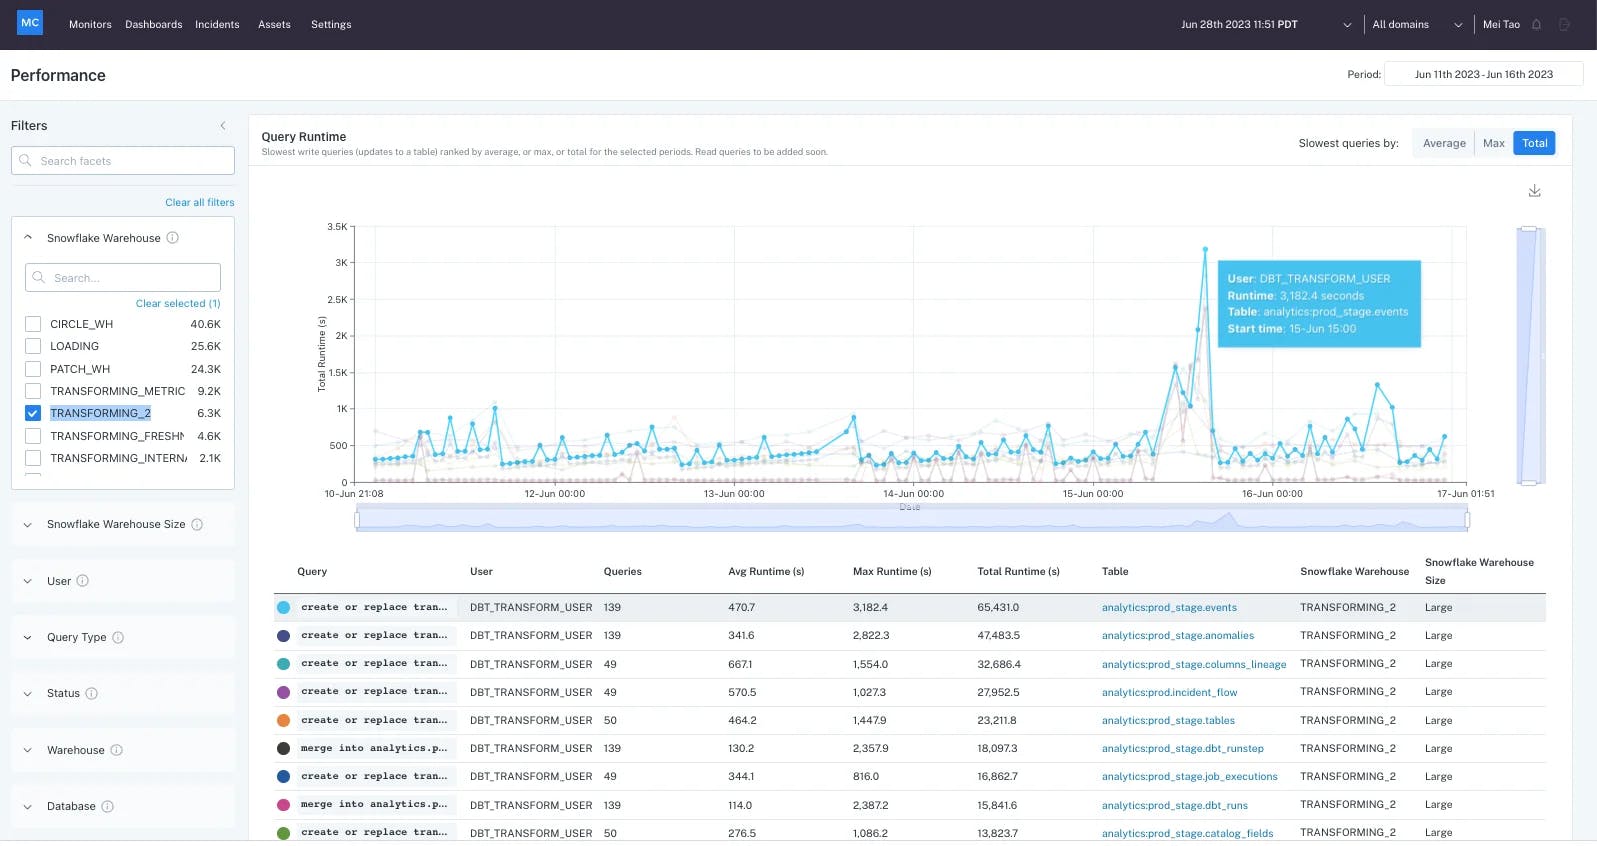
Source: Monte Carlo
Root Cause Analysis
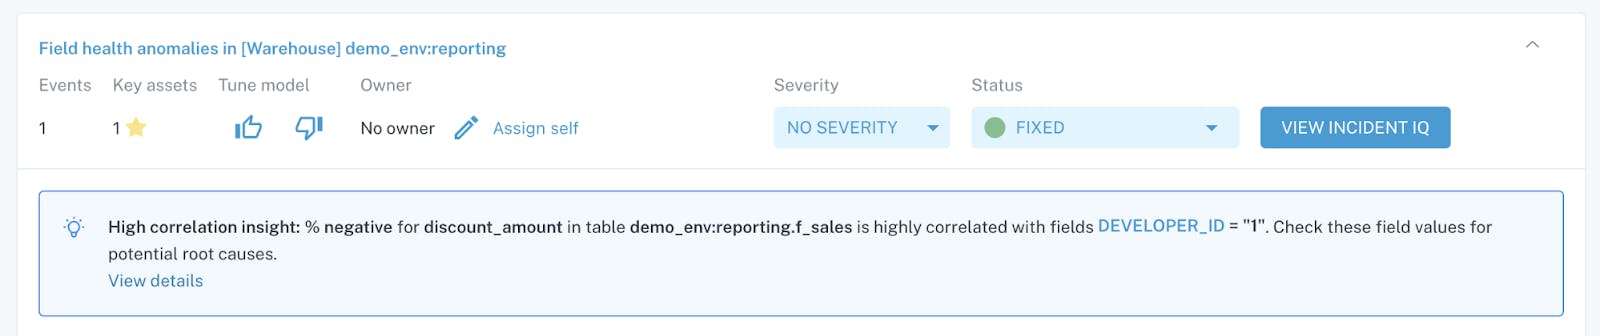
Source: Monte Carlo
Monte Carlo offers root cause analysis to surface insights on the source causing a particular data incident. Users can understand whether data was problematic from its inception and pinpoint the source generating it. It uses data lineage, query logs, and the content of the table to automatically generate its findings. Based on past investigations, it suggests queries for troubleshooting.
Market
Customer
Monte Carlo’s typical customer profile is a mid-market company with 200 to 5K employees within data-intensive industries, such as ecommerce, fintech, and retail. As of 2022, its enterprise customers include companies like Fox, Cisco, and JetBlue. It is used by different members of a data team, from data engineers to data analysts.
At large companies, the common approach to address data quality issues is for internal teams to develop an in-house system. While smaller companies with light technical teams saw the need for observability capabilities, they lacked the bandwidth to build an in-house solution. Monte Carlo’s solution focuses on filling this gap, eliminating the need to build a custom data observability solution that could cost half a million dollars and take 24 weeks to implement. Monte Carlo fits within a company’s cloud-native architecture and data stack, as it integrates with Databricks, Snowflake, AWS, GCP, and Azure.
Market Size
Gartner estimates that by 2026, 50% of enterprises that implement distributed data architectures will adopt data observability tools, up from less than 20% in 2024. Almost half of the top seven biggest companies use data as their primary product, and 92% of data management leaders surveyed in 2023 agree data observability would be a core part of their data strategy in the next three years.
Although the term “data observability” was coined in 2019, this market plays directly into the broader AI observability market, which is forecasted to grow from $2.4 billion in 2023 to $4.1 billion by 2023, at a CAGR of 11.7%.
Competition
Although data observability is still in its early stages since its inception in 2019, a number of companies have emerged to compete against Monte Carlo. Due to a lack of a universal definition, vendors often offer different capabilities, each branded as data observability, which can lead to confusion in the market. Different vendors support different areas and data environments, but as of 2023, there is no provider that supports full end-to-end observation. Root cause analysis and recommendations are considered an important differentiator amongst the competition.
Acceldata: Founded in 2018, Acceldata is an enterprise data observability solution that had raised $105.6 million from investors like Prosperity7 Ventures as of September 2024. Acceldata operates with both on-prem and cloud deployments, whereas Monte Carlo focuses on cloud data sources. Compared to Monte Carlo, Acceldata also monitors and optimizes the cost and performance of queries as a form of budget tracking. It keeps FinOps in the loop with visibility on spend rates across teams. Acceldata offers a free trial of its service.
Anomalo: Founded in 2018 by Instacart alumni, Anomalo had raised a total of $72 million as of September 2024. In January 2024, the company raised a $33 million Series B led by SignalFire and Databricks Ventures as a strategic investor. It focuses on root cause analysis, and a key differentiator is its self-supervised ML models that train on the history of a dataset. These models are designed to limit false positives, as seasonal changes in a company’s dataset can lead to false negatives. Anomalo was recognized as Databricks’ Emerging Partner of the Year in 2024. It has seen traction with large enterprises, doubling its Fortune 500 customers in Q3 2023. As of 2023, notable users include Block, Buzzfeed, Discover Financial Services, and Notion. As of January 2024, its ARR had grown close to $15 million, growing 177% year-over-year.
Metaplane: Metaplane was founded in 2019 and, as of September 2024, had raised $22.2 million in total funding from investors such as Felicis and Snowflake. As of March 2024, Metaplane had grown its customer base three-fold to over 100 enterprises and had detected and resolved as many as 80K incidents. Metaplane offers a freemium model which it identifies as a driver for organic growth. Metaplane can also monitor changes in data usage and cloud warehouse spend. It stands out for its ease of use and its value for small businesses. The company also provides usage analytics, spend analysis, and monitors highly used assets.
Manta: Manta, founded in 2016, was acquired by IBM in 2023 for an undisclosed amount after raising a total of $52 million. Manta focuses on data lineage and increases data pipeline transparency for businesses for effective data governance. Manta complements IBM’s watsonx.ai offerings and helps businesses determine whether the right data was used for their AI models. Manta can also integrate with the IBM Knowledge Catalog to highlight technical data lineage alongside business metadata.
Cribl: Cribl, founded in 2018, had raised over $720 million as of September 2024. The company raised a $200 million Series E from GV at a $3.5 billion valuation with participation from existing investors IVP, CRV, and CapitalG. Other notable investors include Sequoia, Redpoint, Greylock, and others. Cribl’s product allows organizations to collect observability, security, and telemetry data and route it to tools to query data and take action. Formerly from Splunk, Cribl’s founders claim that only Cribl offers a “vendor-neutral, agnostic enterprise software solution.” Cribl is a suite of products including Cribl Search, an analytics tool to perform search-in-place queries. Its other products are Cribl Stream, Cribl Edge, and Cribl Lake, making up a platform that manages distributed data collection and processing as well as its storage.
Business Model
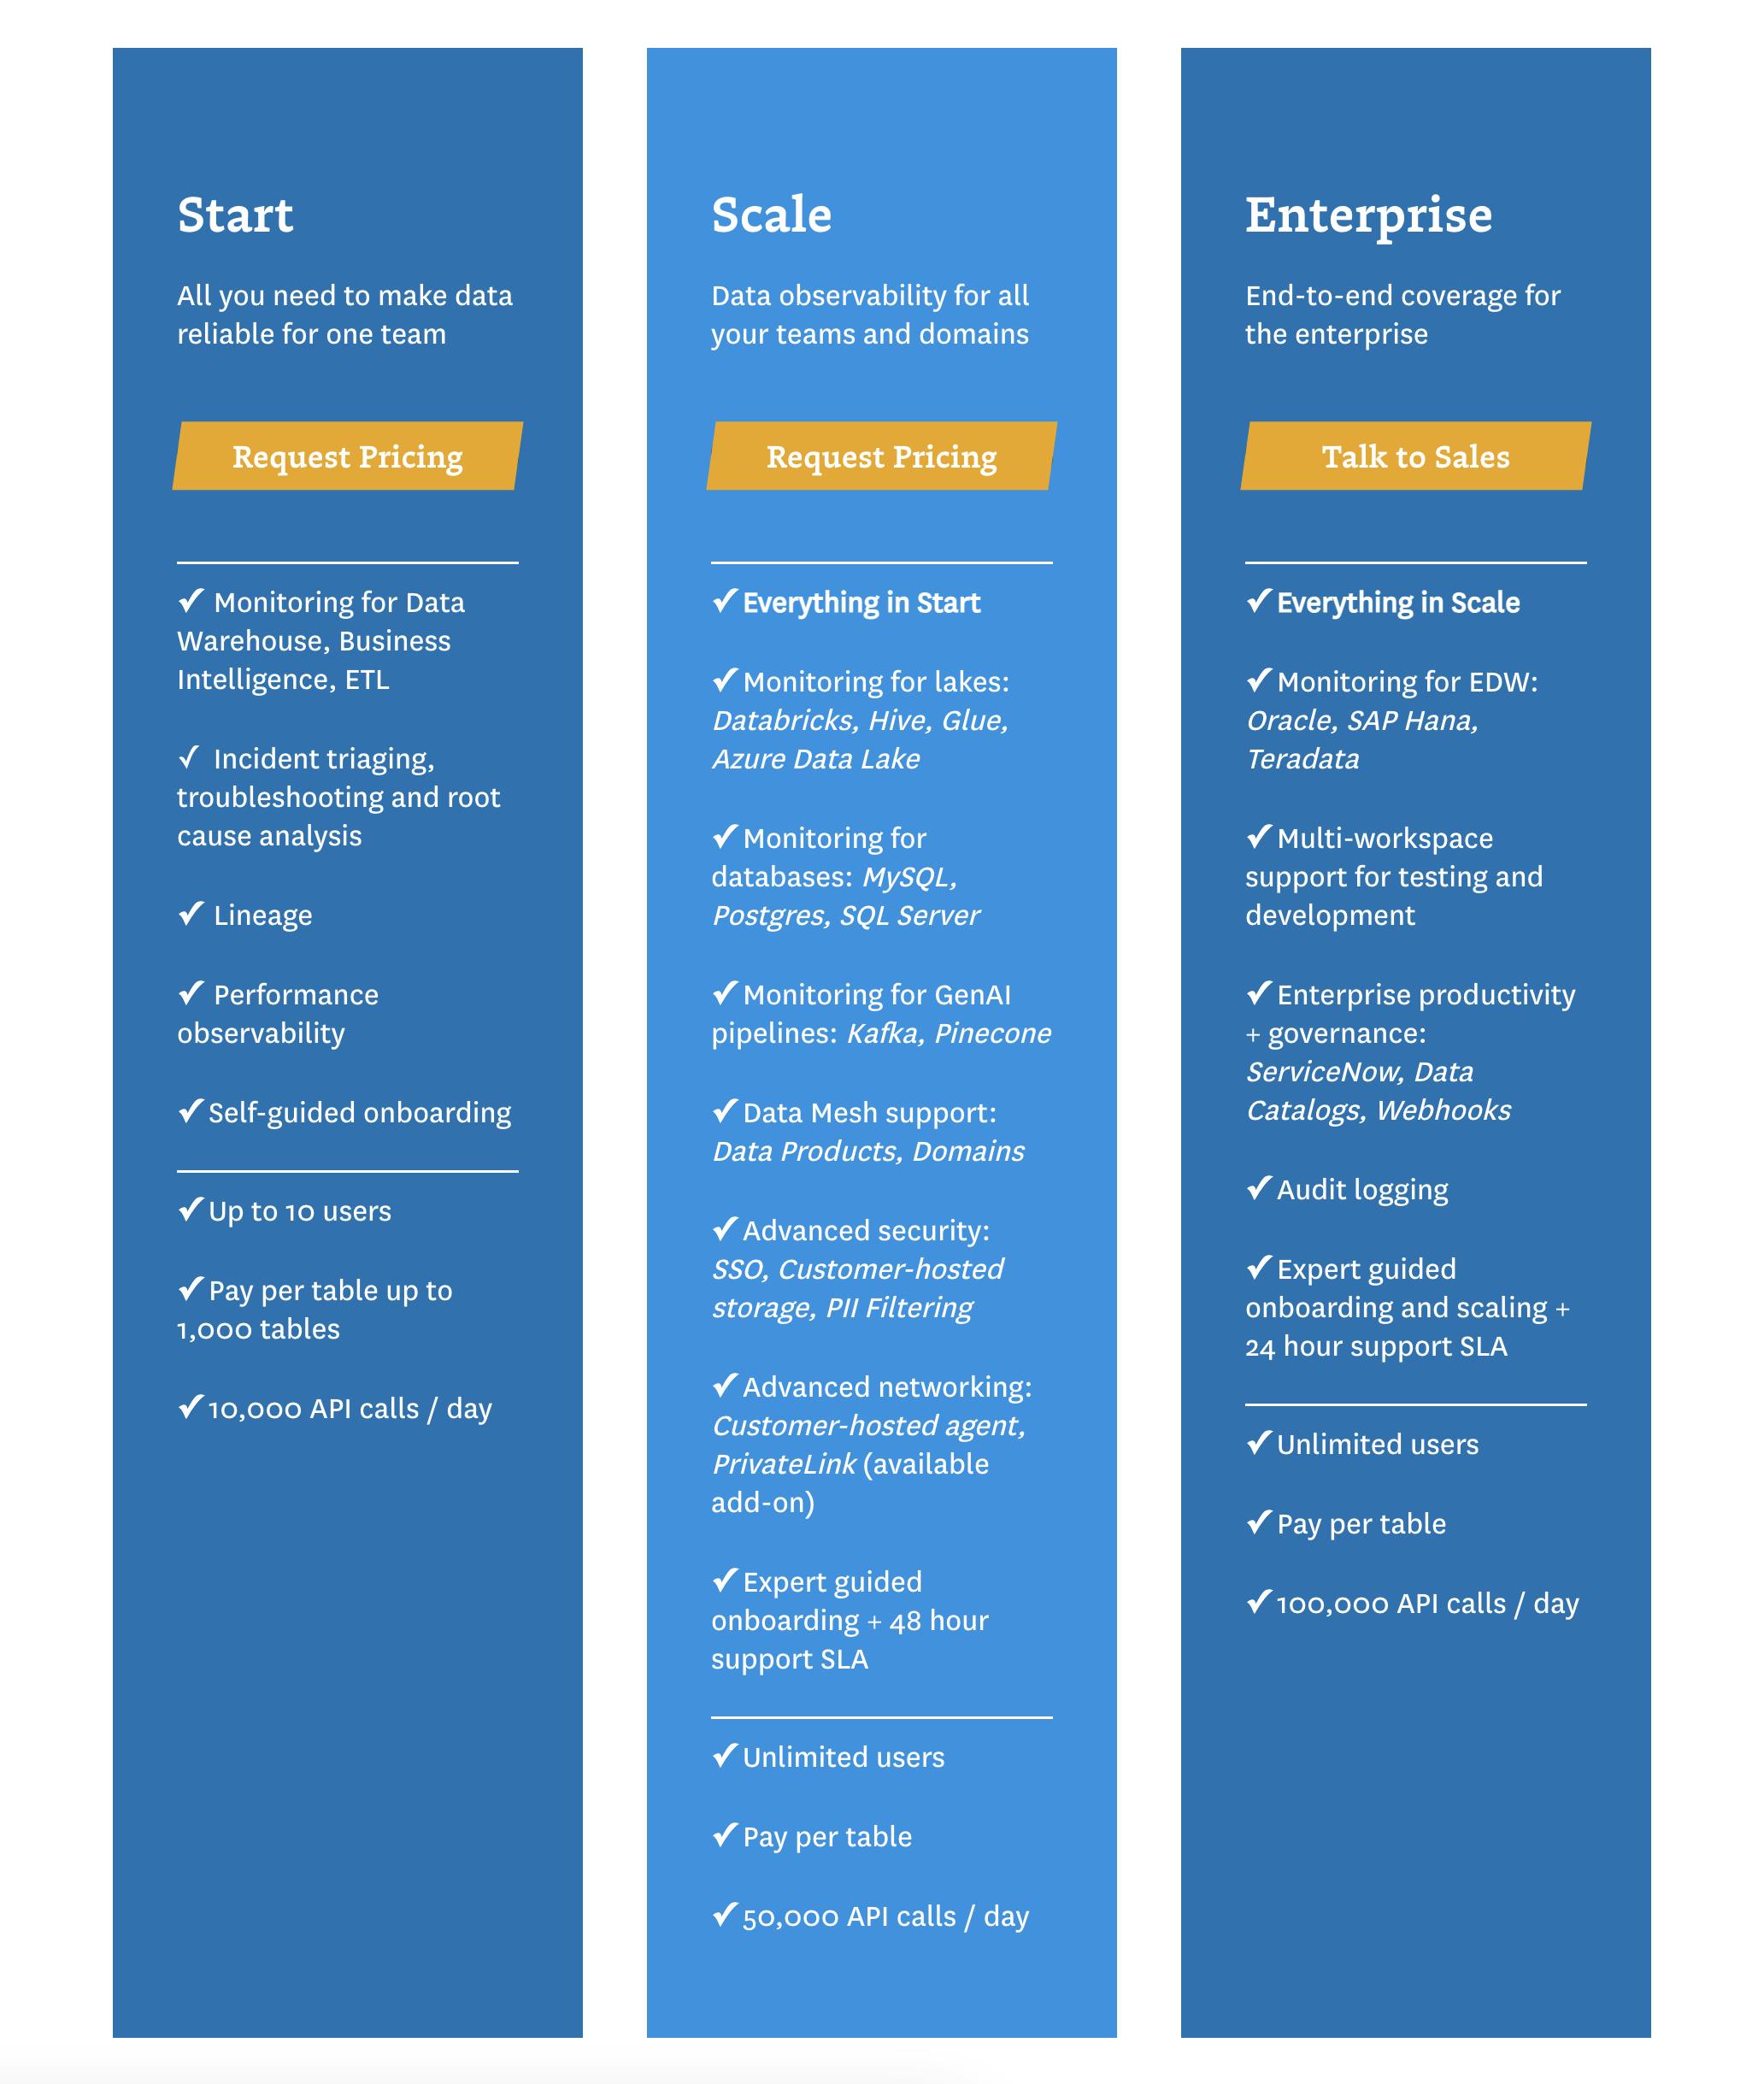
Source: Monte Carlo
Monte Carlo offers a pay-as-you-go SaaS model where customers are charged based on how many tables and data resources they monitor. It offers three tiers for small, medium, and enterprise companies, with an increasing number of users and API calls per day. It promises a plug-and-play experience for users to get value on the platform out of the box. Notably, it lacks a freemium model employed by other competitors. Monte Carlo also provides a data quality calculator for prospective users to measure the value of data quality and quantify the data engineering time saved with its service.
Traction
Monte Carlo reportedly had scaled its ARR by 8x from the one-year period between summer 2020 and summer 2021. The company also indicated it had seen revenue increase 800% year-over-year after its Series D in May 2022. Some unverified estimates indicated Monte Carlo’s revenue may be above $40 million as of September 2024. In 2021, Monte Carlo indicated it had renewed 100% of its customers. Notable customers include PepsiCo, Jetblue, and CNN, as well as companies like Affirm, Sofi, and OpenTable.
Valuation
In May 2022, Monte Carlo raised a $135 million Series D at a $1.6 billion valuation. This round was led by IVP and included prior investors such as Accel, GGV, ICONIQ, and Redpoint. As of September 2024, Monte Carlo had raised a total of $236 million in funding. The company’s Series C in August 2021 raised $60 million and was led by ICONIQ Growth and joined by GGV, Redpoint, and Salesforce Ventures. Monte Carlo raised its Series A through C funding in less than a year, from September 2020 to August 2021.
Key Opportunities
Data Quality for Generative AI
The high demand for data leaders to implement generative AI has led to a surge in demand for data observability. AI highlights the need for distributed data landscapes, diversity of datasets, and ensured data quality. An estimated 35% of AI projects will either fail or experience delays due to poor data quality. Furthermore, poor data quality can introduce noise that compromises the accuracy of generative AI models, which can lead to misleading answers or nonsensical output. As the generative AI data stack evolves, Monte Carlo plans to position itself as a key ingredient to understanding the data powering AI models. In August 2024, for example, Monte Carlo launched a Trusted Data for AI (TDAI) Advisory Council, with representation from companies such as Pepsico, BP, and CreditKarma. As Barr Moses explained when announcing the council:
"AI has skyrocketed to the top of every leader’s priority list, unlocking a host of opportunities for innovation. While organizations have invested in resources, technologies, and even teams to drive forward their AI initiatives, all too often they overlook one of AI’s most fundamental building blocks: high quality, reliable data.”
AI Observability
Just as data observability evolved from APM, observability can evolve to monitor AI/ML applications. There is an opportunity for an end-to-end platform that monitors key functions like LLM testing, monitoring, and explainability. Emerging model monitoring platforms also monitor data drift, which is when the performance of an ML model in production slowly gets worse over time. Competitors like Acceldata have already started addressing problems like data drift. Monte Carlo considers AI to be another data product with a need for reliability and visibility and is adding integrations with popular tools like Pinecone and Apache Kafka.
Breaking Down Data Silos
The “data shift right movement” aims to empower non-technical stakeholders to become data-fluent. By making it easier for business users to access and share data, they can better make decisions. Monte Carlo wants to help users create a single source of truth and consolidate data silos. It launched a Data Reliability Dashboard in 2022, which aligns data teams with business stakeholders by offering a bird’s-eye view of data reliability KPIs. Secoda, a data catalog startup, integrates with Monte Carlo to create a centralized data observability solution that enhances data discovery. With this potential for scale, Monte Carlo has the opportunity to democratize data for employees outside of the data team. It can refine its user interface to be accessible to a non-technical stakeholder. Another opportunity is to use LLMs to help users interpret the technical jargon of data monitoring and generate actionable insights.
Key Risks
ROI For Observability Tools
Though two-thirds of organizations spend over $100K annually on observability tools, more than 74% of companies struggle to reach true observability. The ROI from data observability tools depends on how well an organization follows best practices. It can be difficult to make a business case for observability tools, which requires short-term sacrifices for long-term success.
Fragmented Market
Reminiscent of the APM market, the data observability landscape is fragmented and competitive. As of June 2024, Gartner indicated that “very few vendors [offer] comprehensive tools that cover all five observation areas (data content; data flow and pipelines; infrastructure and compute; user, usage and utilization; and financial allocation).” As a result, data leaders can pick and choose vendors, sometimes using several at once, to craft a targeted solution for their needs.
Data Security
For certain verticals, like healthcare, financial services, government, and retail, security is crucial. Security vulnerabilities can lead to a widespread, costly impact. There is a growing focus on data governance in terms of how an organization collects, analyzes, and uses its data. Strict security protocols, such as customer data in European markets, can limit the level of authorization customers give their data monitoring tools.
Summary
Monte Carlo is a data observability platform with a mission to help organizations monitor abnormal patterns in their data. The company, and its founder Barr Moses, defined the data observability market in 2019. Monte Carlo fills the gap for organizations that need better visibility into their data pipelines with integrations that consolidate the data from a modern data stack. Given the heightened focus on data and generative AI to drive business outcomes in 2024, Monte Carlo is positioned to accelerate the adoption of data and validate the data as it flows through the pipeline.